Fig. 3
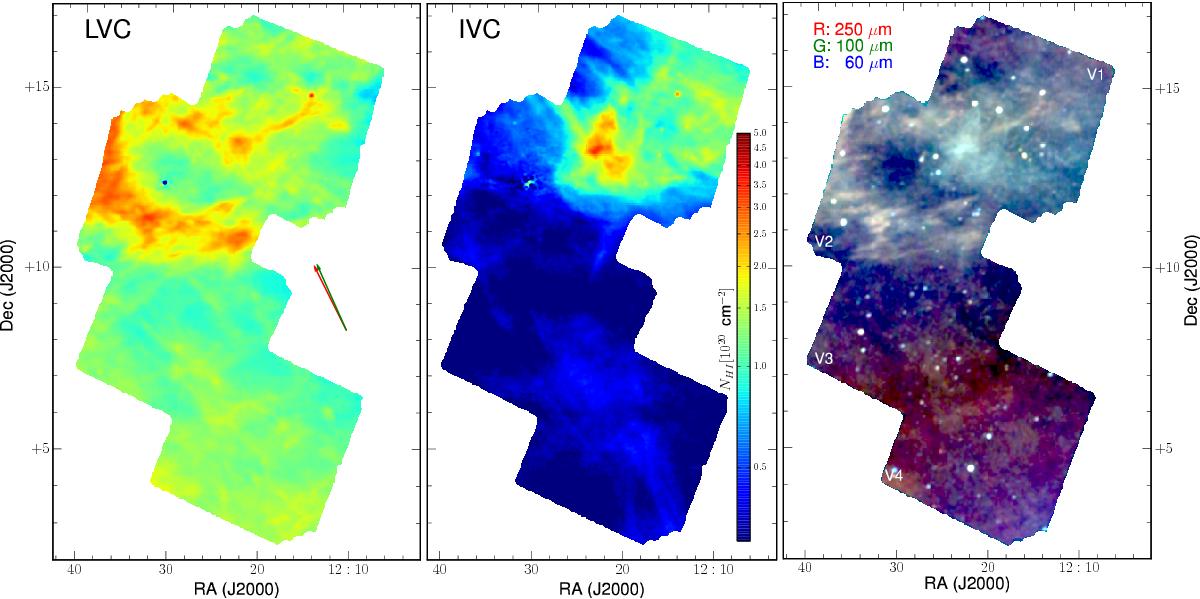
HeViCS field: ALFALFA H i column density of the LVC component with −20 <vLSR/km s-1< 100 (left panel), and of the IVC component with −100 <vLSR/km s-1< −20 (central panel). Both components are shown with the same color scale. The RGB composite in the right panel shows dust emission at 60 μm (blue), 100 μm (green), and 250 μm (red). All images are convolved to a resolution of FWHM 4![]() 8. For this figure, the full 250 μm map was obtained by removing the mutual offsets between the HeViCS fields; the quantitative analysis is instead performed separately on each of the four fields, as motivated in Sect. 2.2. In the left panel, the red and green arrows indicate the direction of the Galactic and ecliptic north, respectively.
8. For this figure, the full 250 μm map was obtained by removing the mutual offsets between the HeViCS fields; the quantitative analysis is instead performed separately on each of the four fields, as motivated in Sect. 2.2. In the left panel, the red and green arrows indicate the direction of the Galactic and ecliptic north, respectively.
Current usage metrics show cumulative count of Article Views (full-text article views including HTML views, PDF and ePub downloads, according to the available data) and Abstracts Views on Vision4Press platform.
Data correspond to usage on the plateform after 2015. The current usage metrics is available 48-96 hours after online publication and is updated daily on week days.
Initial download of the metrics may take a while.