Fig. 11
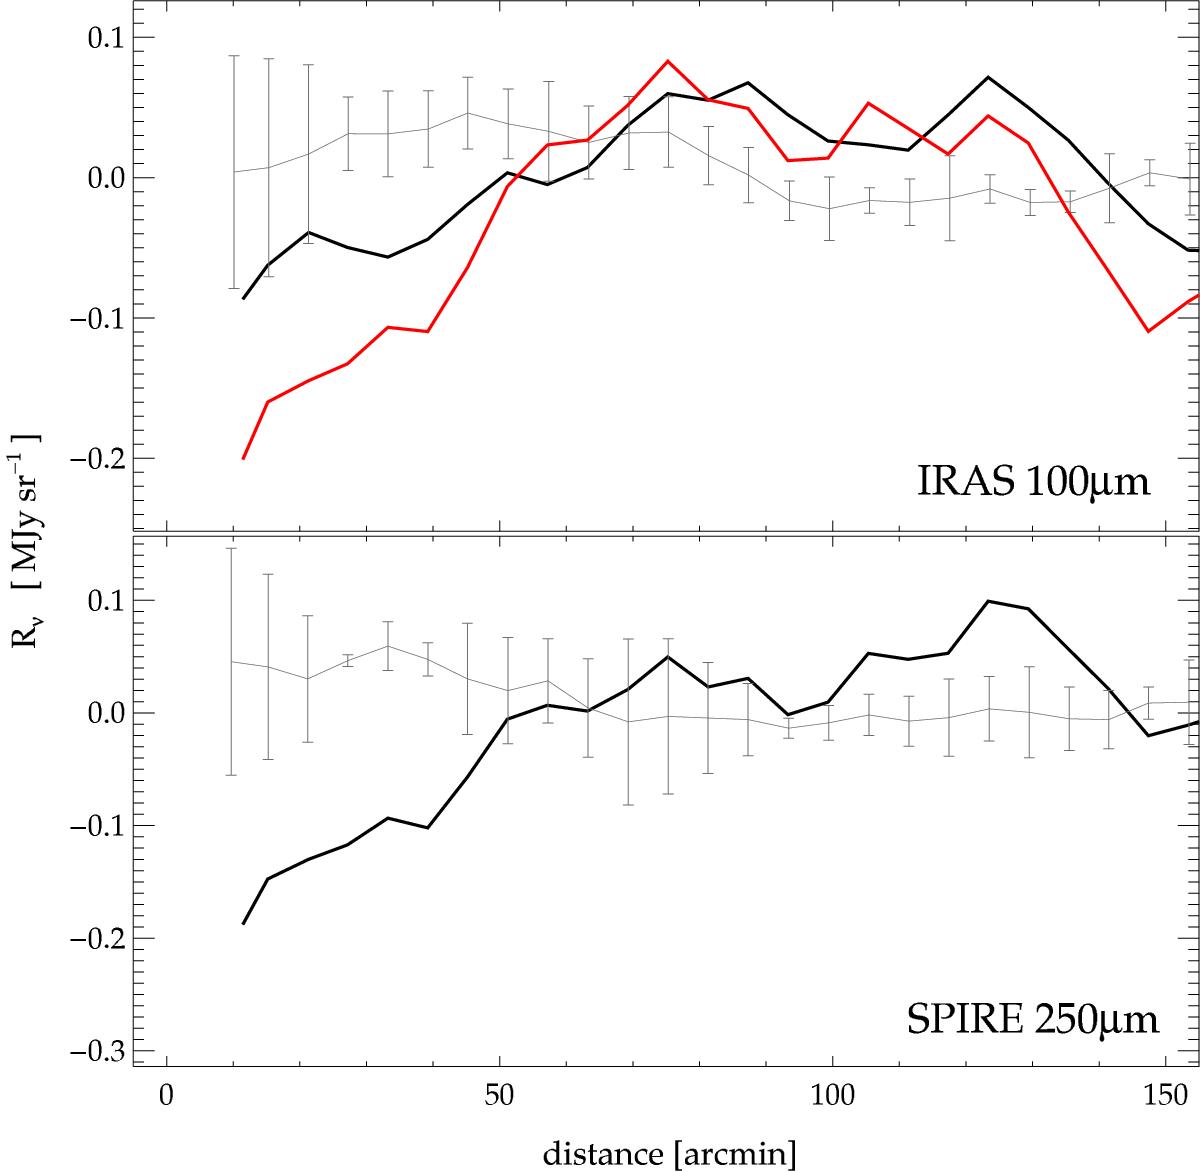
Profile of the 100 and 250 μm residuals as a function of the projected distance from M 87 for the V2 field (black solid line). The gray lines and error bars are the average and standard deviation of the profiles from the center of each of the other three HeViCS tiles. The red solid line is the profile at 100 μm predicted from the 250 μm data and assuming the average 100/250 color ratio (see text for details). Each profile was obtained by azimuthally averaging the residuals over circular coronas of width 6′.
Current usage metrics show cumulative count of Article Views (full-text article views including HTML views, PDF and ePub downloads, according to the available data) and Abstracts Views on Vision4Press platform.
Data correspond to usage on the plateform after 2015. The current usage metrics is available 48-96 hours after online publication and is updated daily on week days.
Initial download of the metrics may take a while.