Fig. 8
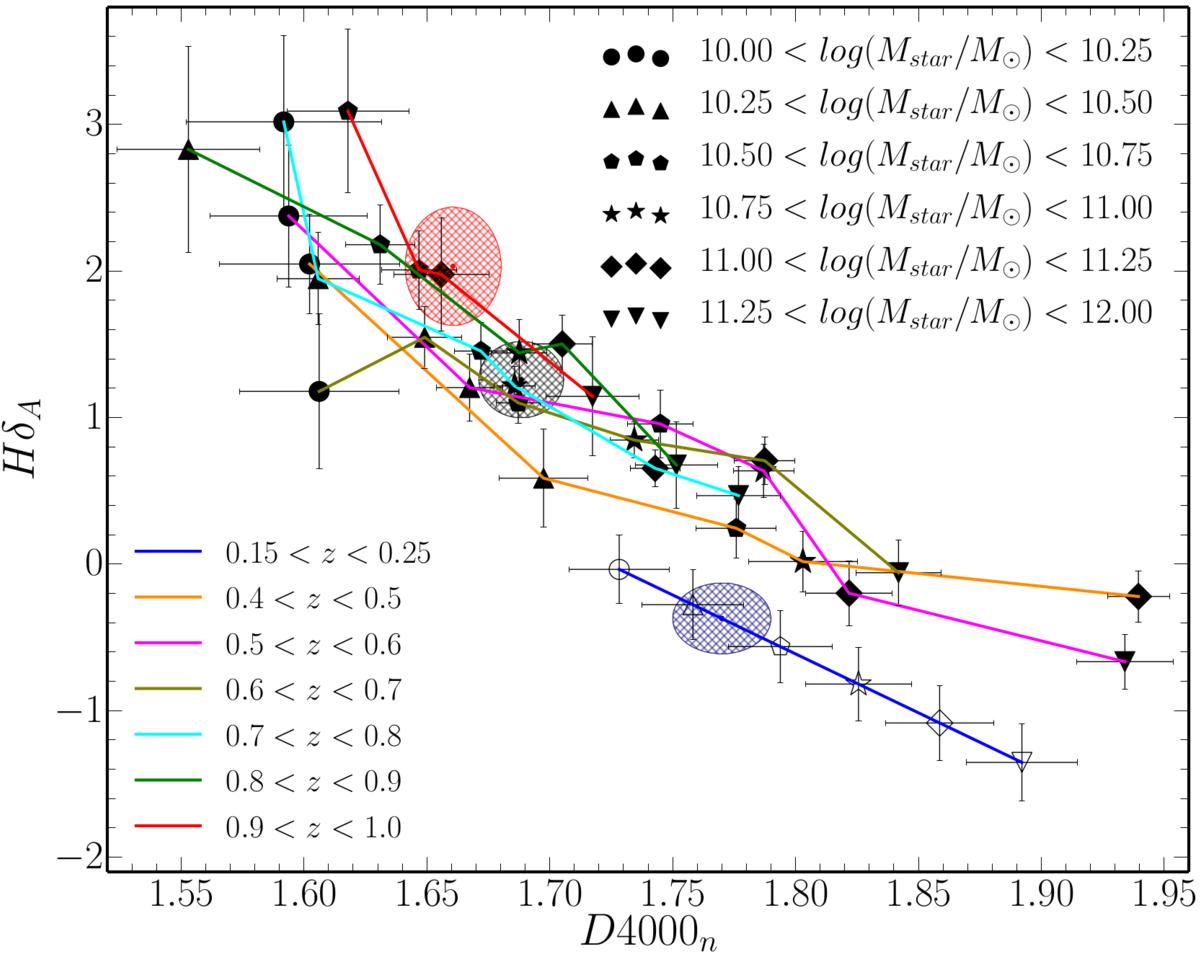
HδA as a function of D4000n for different redshift and stellar mass bins obtained for VIPERS stacked spectra. Error bars were obtained on the basis of Monte Carlo simulations. Values of HδA for SDSS passive red galaxies obtained from the linear fit of HδA-stellar mass relation for median stellar mass bins. D4000n values were obtained in an analogous way. Error bars were derived from the uncertainties of the linear fits. The spectral feature strength expected for galaxies with stellar mass corresponding to the transition mass at which the mass functions of the star-forming and quiescent galaxy populations cross is indicated with blue, black, and red ellipses at z ~ 0.1, z ~ 0.7, z ~ 1, respectively. The error bars of the estimated spectral features for transition masses correspond to the areas of ellipses.
Current usage metrics show cumulative count of Article Views (full-text article views including HTML views, PDF and ePub downloads, according to the available data) and Abstracts Views on Vision4Press platform.
Data correspond to usage on the plateform after 2015. The current usage metrics is available 48-96 hours after online publication and is updated daily on week days.
Initial download of the metrics may take a while.