Fig. 7
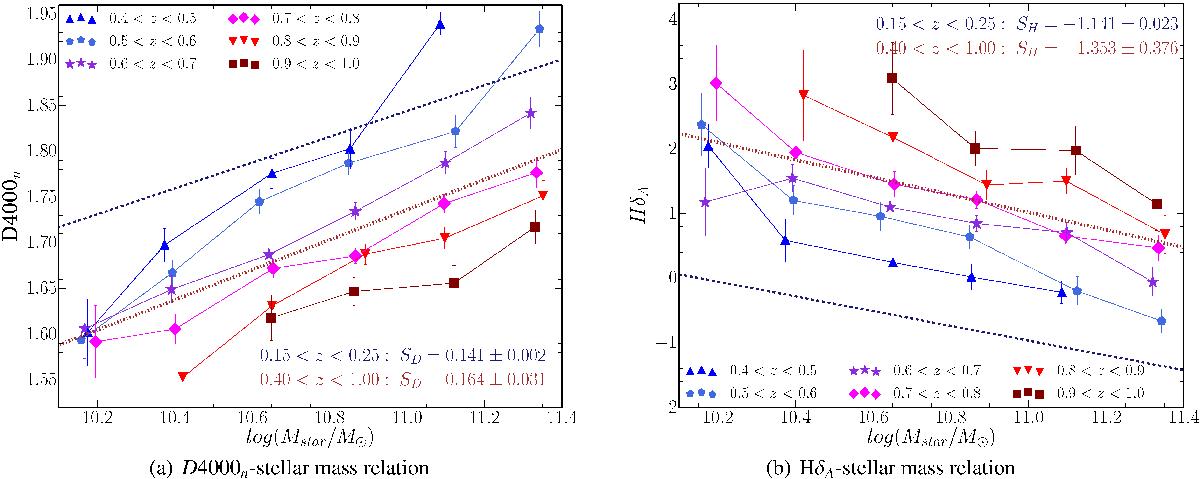
D4000n and HδA as a function of stellar mass for VIPERS stacked spectra of passive red galaxies. The linear fits to the whole VIPERS sample and to the SDSS sample are shown as brown dot-dashed and blue dashed lines, respectively. The slopes and relative uncertainties of the linear relationships between spectral features D4000n and HδA (SD and SH), respectively, and the stellar mass for the local SDSS sample and for the VIPERS sample are annotated.
Current usage metrics show cumulative count of Article Views (full-text article views including HTML views, PDF and ePub downloads, according to the available data) and Abstracts Views on Vision4Press platform.
Data correspond to usage on the plateform after 2015. The current usage metrics is available 48-96 hours after online publication and is updated daily on week days.
Initial download of the metrics may take a while.