Free Access
Fig. 4
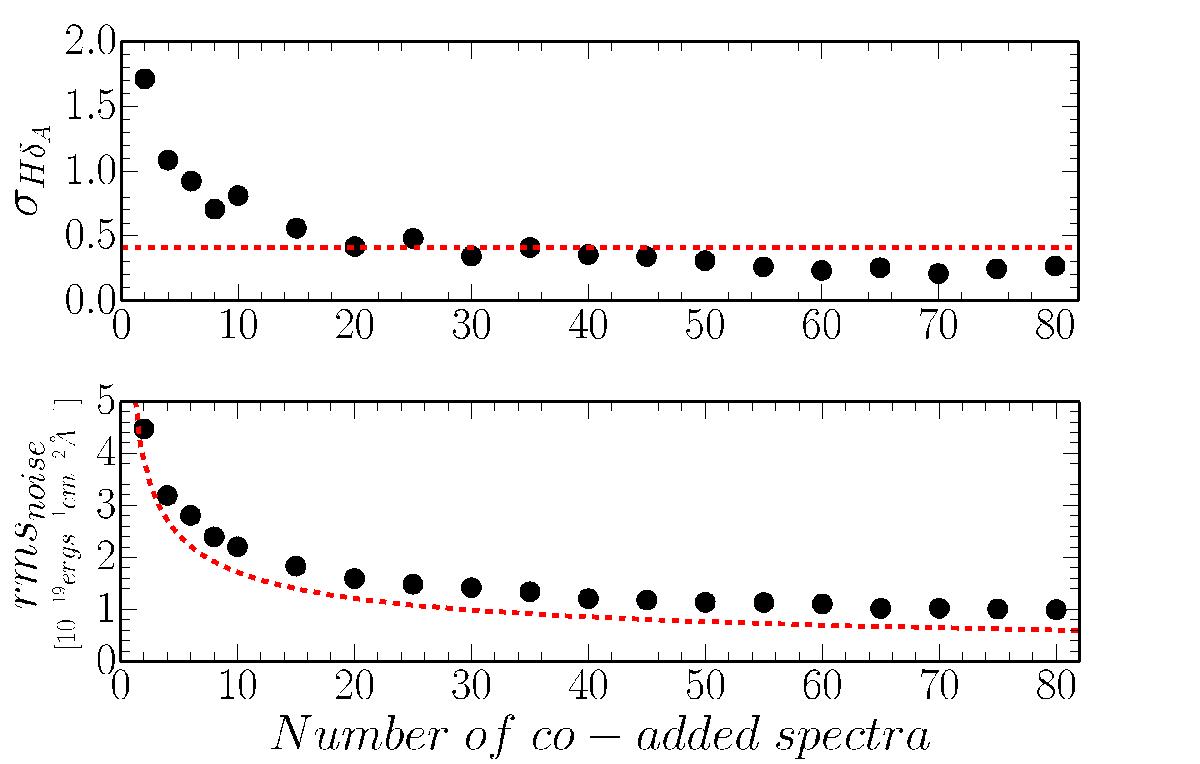
Distribution of standard deviations for HδA (upper panel) and of rms of noise around Hδ line as a function of the number of co-added spectra. The red dashed line represents 3 times the standard deviation calculated for spectra composed of all 360 galaxies (upper panel) and median rms of noise reduced by ![]() (lower panel).
(lower panel).
This figure is made of several images, please see below:
Current usage metrics show cumulative count of Article Views (full-text article views including HTML views, PDF and ePub downloads, according to the available data) and Abstracts Views on Vision4Press platform.
Data correspond to usage on the plateform after 2015. The current usage metrics is available 48-96 hours after online publication and is updated daily on week days.
Initial download of the metrics may take a while.