Free Access
Fig. 2
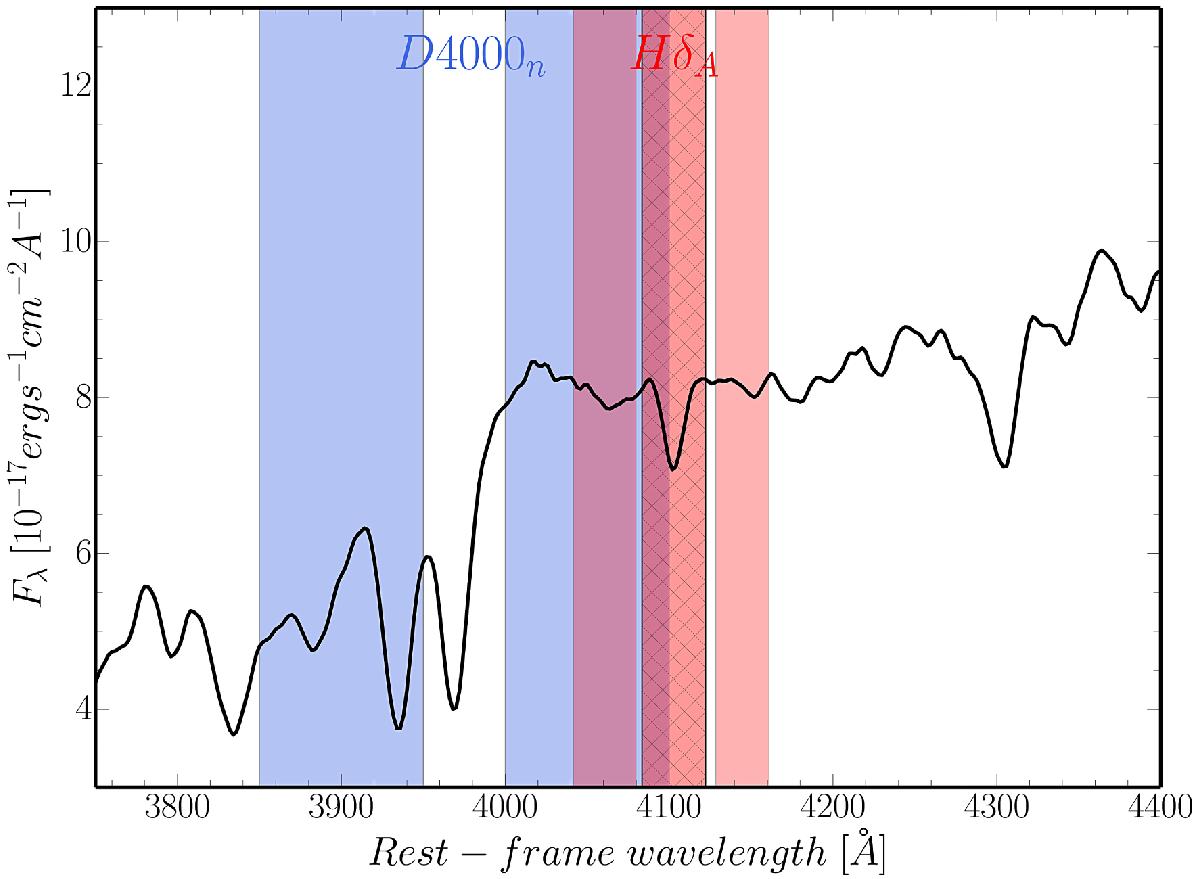
Exemplary stacked spectrum of passive red galaxies taken from the VIPERS database in the wavelength range 3800–5000Å. Blue shaded areas show the ranges used to evaluate the D4000n break. Red regions correspond to pseudocontinua for the HδA, while the hatched area shows the HδA bandpass.
Current usage metrics show cumulative count of Article Views (full-text article views including HTML views, PDF and ePub downloads, according to the available data) and Abstracts Views on Vision4Press platform.
Data correspond to usage on the plateform after 2015. The current usage metrics is available 48-96 hours after online publication and is updated daily on week days.
Initial download of the metrics may take a while.