Free Access
Fig. A.3
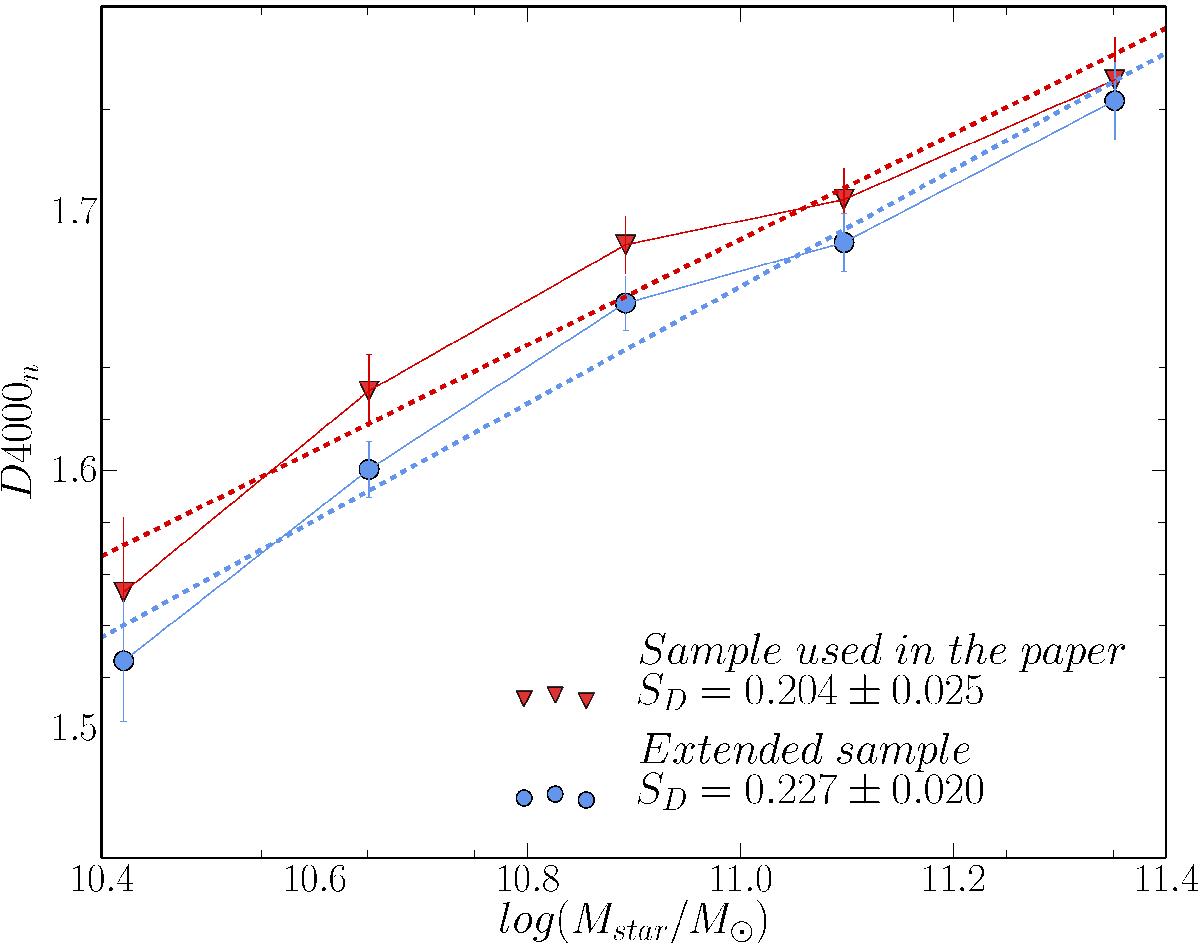
D4000n as a function of stellar mass for VIPERS stacked spectra of passive red galaxies. The linear fits to the sample used in the paper and to sample including the less red part of the galaxy population are shown as red and blue dashed lines, respectively.
Current usage metrics show cumulative count of Article Views (full-text article views including HTML views, PDF and ePub downloads, according to the available data) and Abstracts Views on Vision4Press platform.
Data correspond to usage on the plateform after 2015. The current usage metrics is available 48-96 hours after online publication and is updated daily on week days.
Initial download of the metrics may take a while.