Fig. A.1
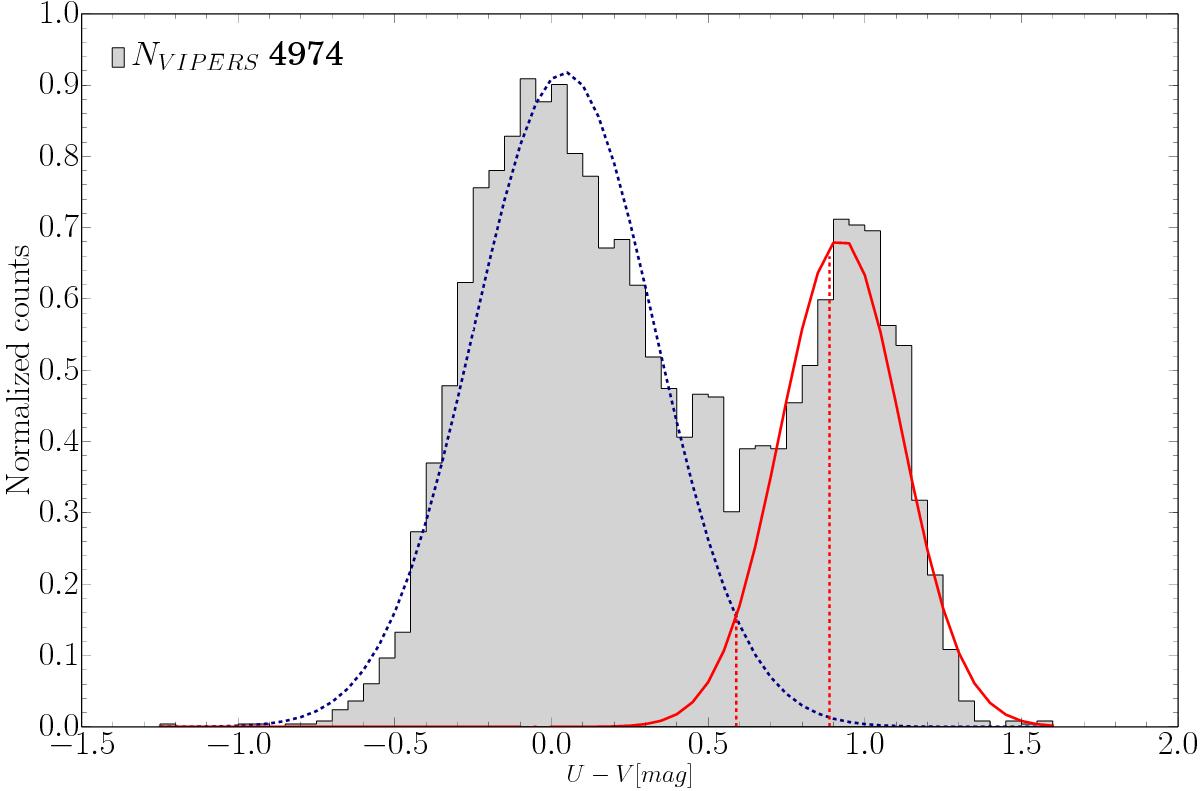
Distribution of rest-frame U−V color of VIPERS galaxies in redshift bin 0.8 < z < 0.9 is shown in gray. The dashed blue and solid red lines represent the Gaussian components corresponding to blue and red galaxy populations, respectively. The horizontal dashed red lines correspond to the separation of red passive galaxies between the crossing with blue distribution and an evolving cut in U−V (Fritz et al. 2014) adopted in this paper. Colors are given in the Vega system.
Current usage metrics show cumulative count of Article Views (full-text article views including HTML views, PDF and ePub downloads, according to the available data) and Abstracts Views on Vision4Press platform.
Data correspond to usage on the plateform after 2015. The current usage metrics is available 48-96 hours after online publication and is updated daily on week days.
Initial download of the metrics may take a while.