Fig. 12
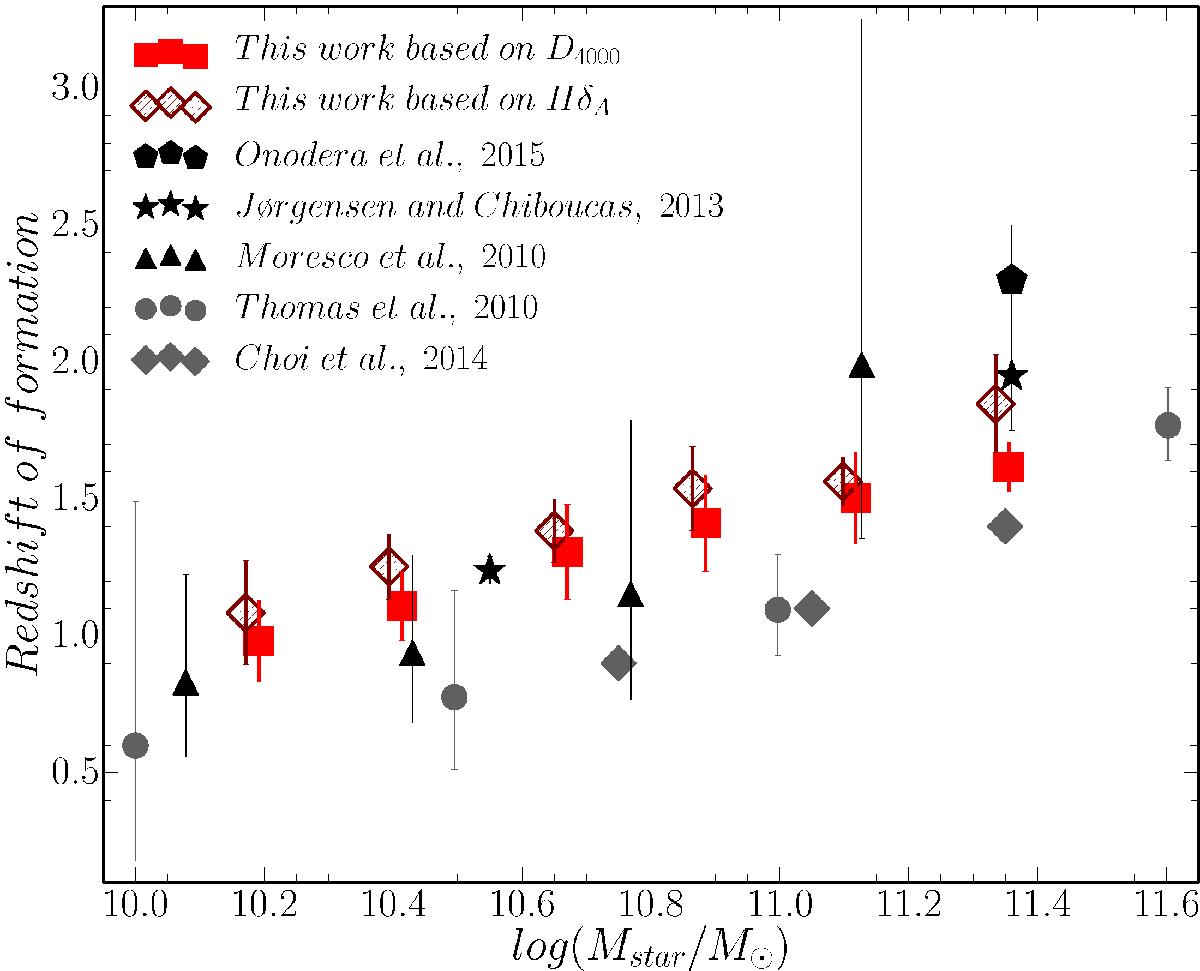
Mean epoch of the last starburst derived from the D4000n and HδA features estimated for VIPERS passive red galaxies observed at 0.4 <z< 1.0 as a function of stellar mass. Error bars represent the standard deviation within each stellar mass bin. Formation redshifts of stellar populations in intermediate-redshift passive red galaxies derived by Onodera et al. (2015), Jørgensen & Chiboucas (2013), and Moresco et al. (2010) are shown by black pentagon, stars, triangles, respectively. Redshifts of formation at which 50% of the stellar mass of SDSS ETGs was formed as computed by Thomas et al. (2010) are shown with gray circles. Errors correspond to the difference in zform of 50% and 80% of the stellar mass. Epochs of star formation in local quiescent galaxies established by Choi et al. (2014) are shown with gray diamonds.
Current usage metrics show cumulative count of Article Views (full-text article views including HTML views, PDF and ePub downloads, according to the available data) and Abstracts Views on Vision4Press platform.
Data correspond to usage on the plateform after 2015. The current usage metrics is available 48-96 hours after online publication and is updated daily on week days.
Initial download of the metrics may take a while.