Fig. 11
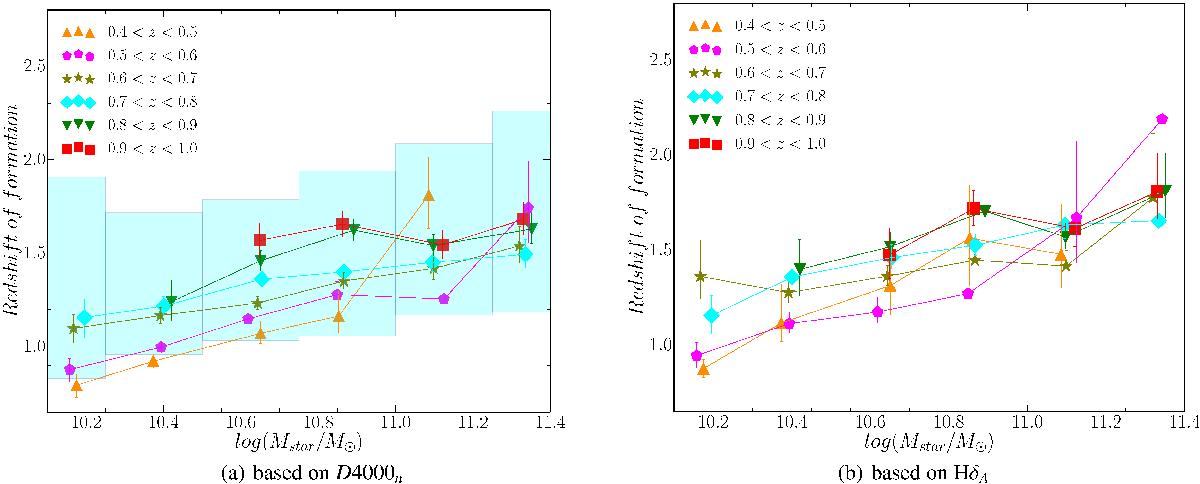
Redshift of formation as a function of stellar mass for a sample of VIPERS passive red galaxies. The error bars correspond to different burst duration (τ = 0.1 and 0.3 Gyr). Both calculations were based on the BC03 model assuming stellar metallicity evolving with mass (0.1 log (Z/Z⊙) for the highest stellar mass bin). The cyan areas correspond to the 1σ weighted distribution of redshift of formation obtained for individual spectra for redshift bin 0.7 <z< 0.8 and different stellar mass bins.
Current usage metrics show cumulative count of Article Views (full-text article views including HTML views, PDF and ePub downloads, according to the available data) and Abstracts Views on Vision4Press platform.
Data correspond to usage on the plateform after 2015. The current usage metrics is available 48-96 hours after online publication and is updated daily on week days.
Initial download of the metrics may take a while.