Fig. 6
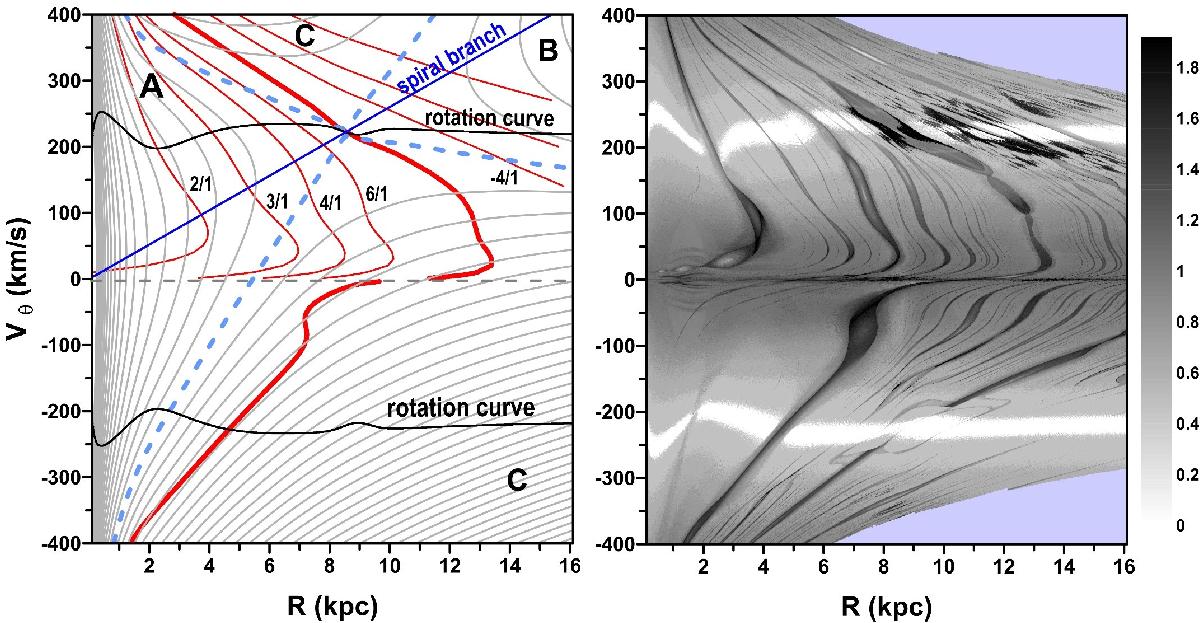
Left: topology of ℋ (3) on the R–Vθ plane of initial conditions, where Vθ = Jϕ/R, pR = 0, and ϕ = 90°. Right: dynamical maps on the same plane calculated for the time series Jϕ(t). The shaded blue regions correspond to domains of initial conditions leading to orbits which go beyond 30 kpc (the region where our model is no longer applicable). The bar relates grey tones and the values of the spectral number N between 1 and 100 in logarithmic scale. All orbits with N> 100 are labelled in black. A typical orbit intersects this plane in two points corresponding to the minimum and maximum values of the coordinate R.
Current usage metrics show cumulative count of Article Views (full-text article views including HTML views, PDF and ePub downloads, according to the available data) and Abstracts Views on Vision4Press platform.
Data correspond to usage on the plateform after 2015. The current usage metrics is available 48-96 hours after online publication and is updated daily on week days.
Initial download of the metrics may take a while.