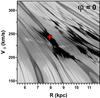
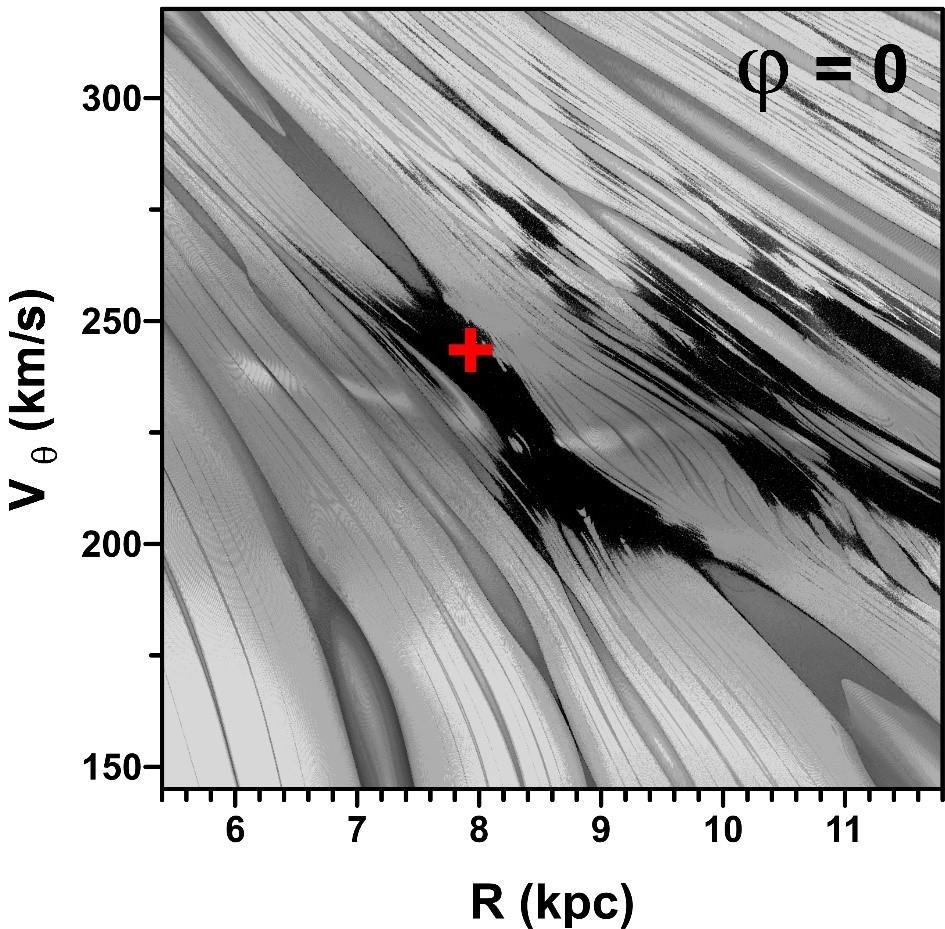
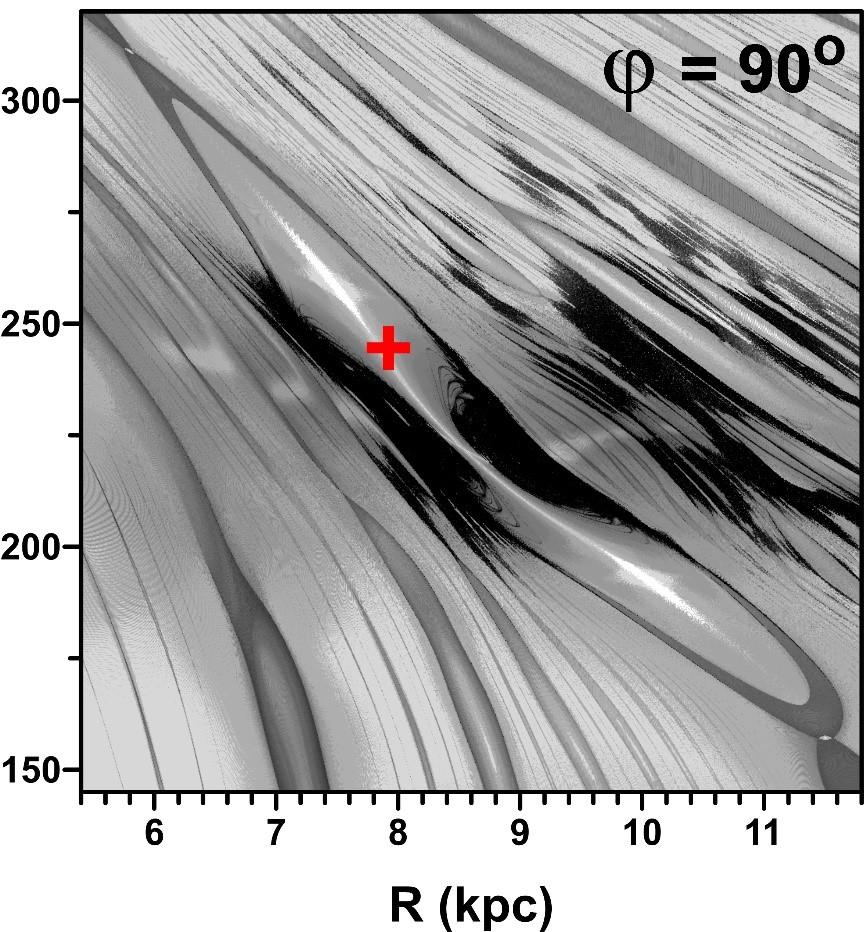
Fig. 12

Left: dynamical map of the neighbourhood of the co-rotation point calculated with the variables pR and ϕ fixed at zero. The red cross shows the position of the SSP integrated backwards until pR = 0. Right: same as in the left graph, except ϕ = 90°. Comparing the graphs, we note that the star would be inside the co-rotation resonance island or in a very chaotic area, depending on the angle ϕ.

Current usage metrics show cumulative count of Article Views (full-text article views including HTML views, PDF and ePub downloads, according to the available data) and Abstracts Views on Vision4Press platform.
Data correspond to usage on the plateform after 2015. The current usage metrics is available 48-96 hours after online publication and is updated daily on week days.
Initial download of the metrics may take a while.