Fig. 6
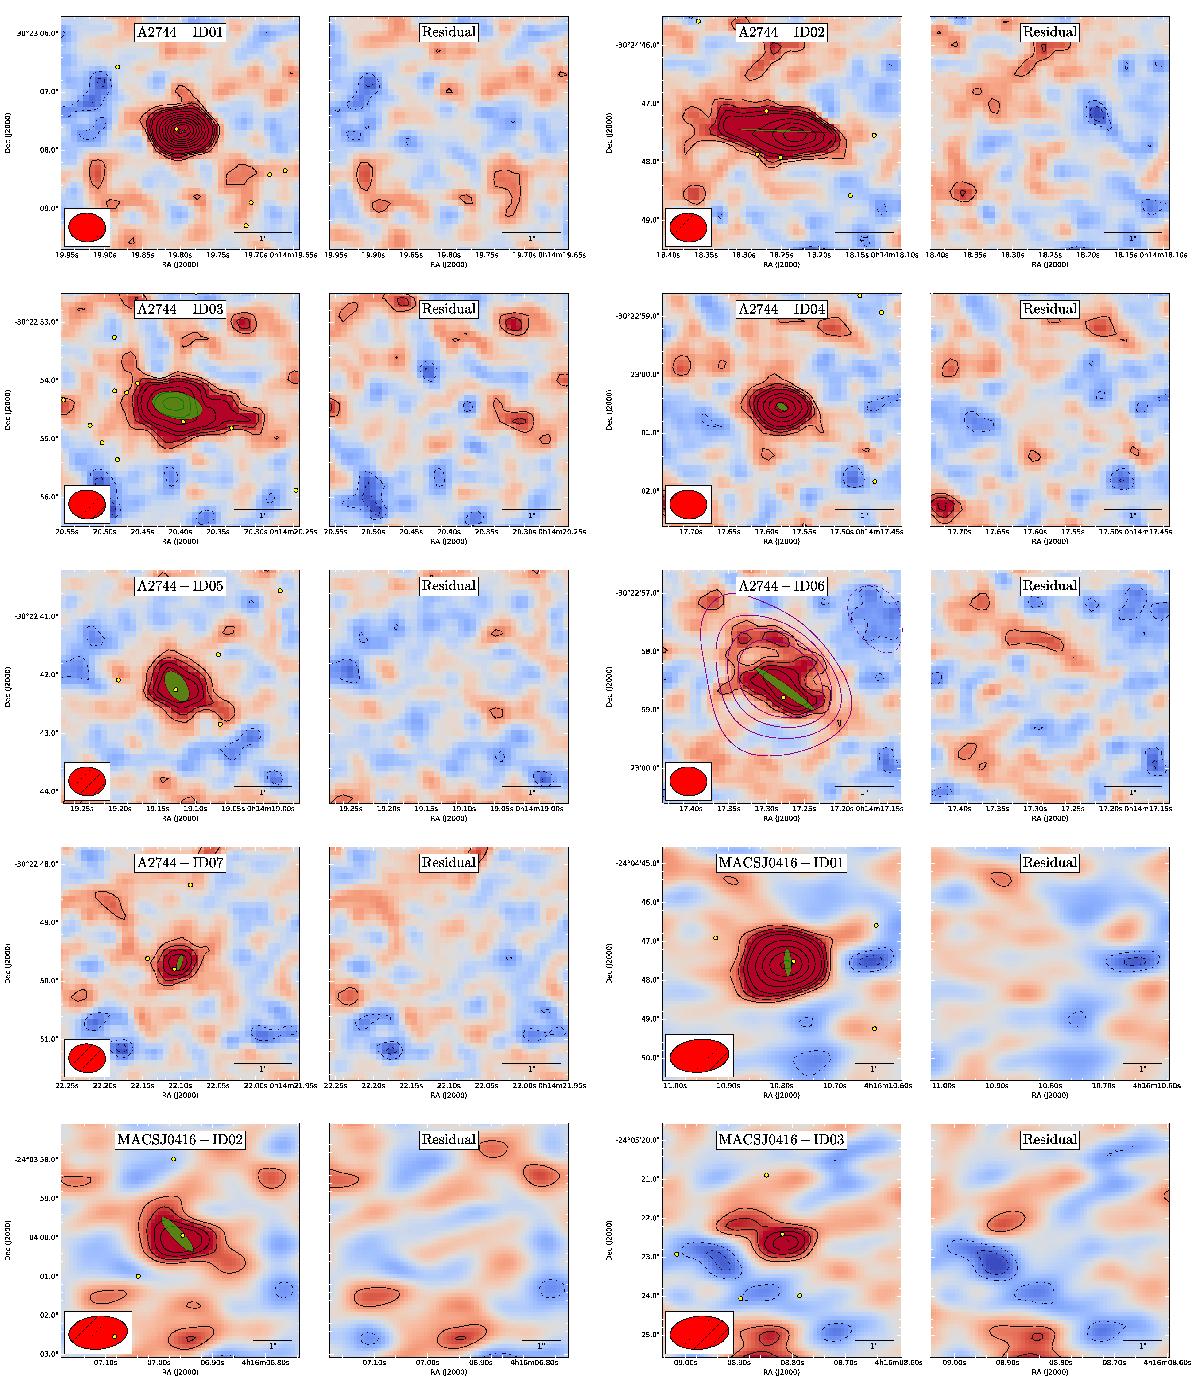
Cutout images of the secure continuum detections in the FFs clusters. Left: 1.1 mm continuum emission image adopting natural weighting, with colors as in Fig. 1. Solid black curves show the positive S/N contours with natural weighting, starting from ±2σ up to ±5σ in steps of 1σ, and then above ±5σ in steps of 2.5σ. Dashed curves show the negative S/N contours. In the bottom left corner we show the corresponding synthesized beam. For A2744-ID06 we additionally overlay solid purple curves showing the S/N contours from the corresponding Taper weighted image. The best-fit 2d elliptical Gaussian model is shown as a green region whose size denotes where the emission is half of the maximum. The yellow points represent the position of optical/NIR detected galaxies. Right: residual of the 1.1 mm continuum emission after the best-fit model is subtracted from the uv visibilities. The color scale is identical to the left-hand side.
Current usage metrics show cumulative count of Article Views (full-text article views including HTML views, PDF and ePub downloads, according to the available data) and Abstracts Views on Vision4Press platform.
Data correspond to usage on the plateform after 2015. The current usage metrics is available 48-96 hours after online publication and is updated daily on week days.
Initial download of the metrics may take a while.