Fig. 10
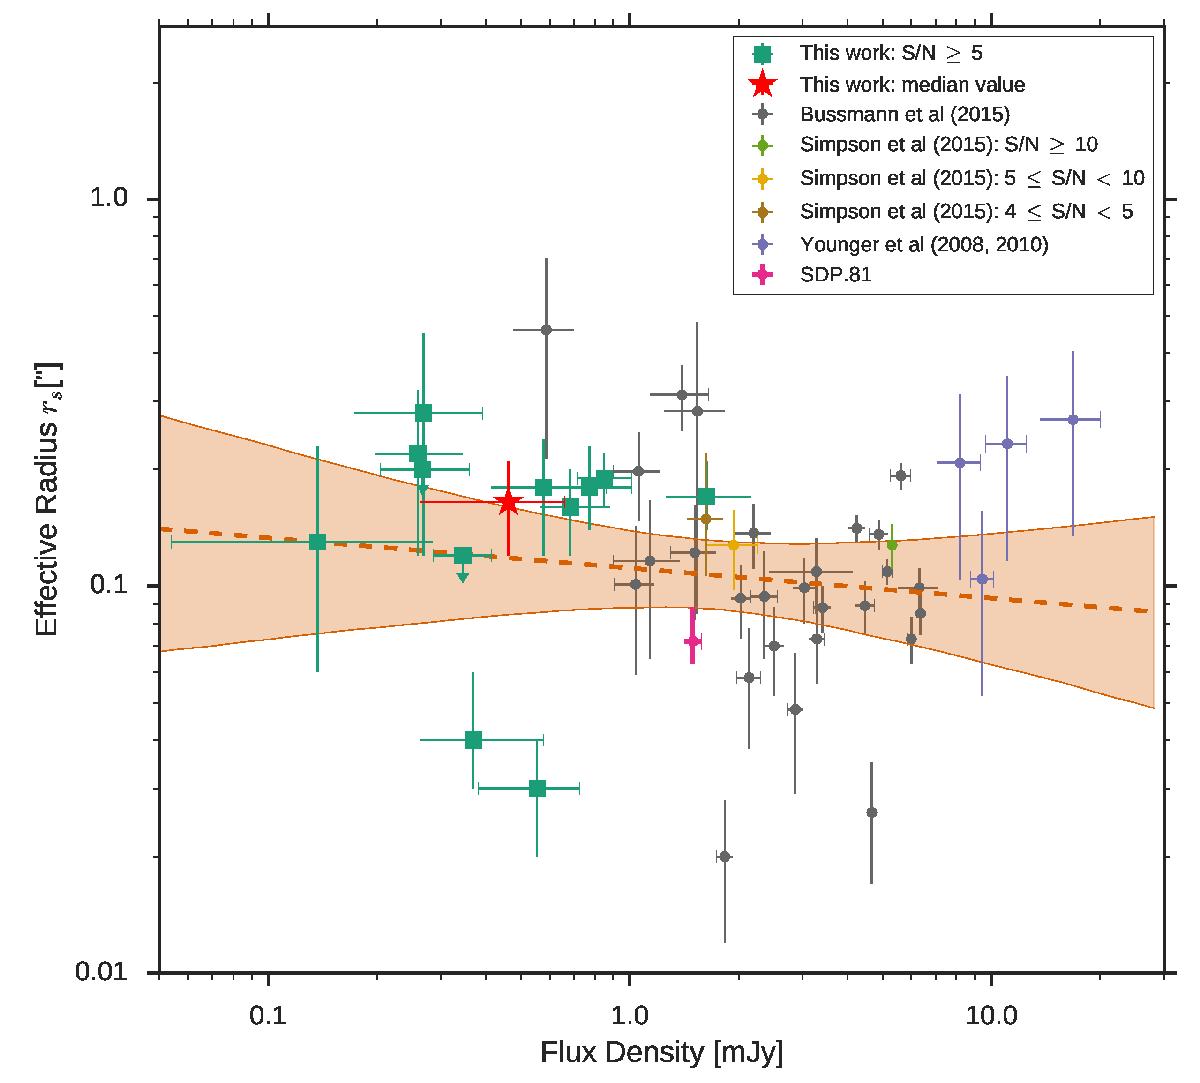
Estimated demagnified sizes, rs,demag, for the ALMA-detected sources in the three FFs clusters studied here, as measured by fits in the uv-plane, plotted alongside measured sizes for several literature samples obtained using interferometric data (Younger et al. 2008, 2010; Valtchanov et al. 2011; Rybak et al. 2015; Simpson et al. 2015; Bussmann et al. 2015). The estimated demagnified 1.1 mm flux densities are shown; for the literature sample, when necessary we have converted to this wavelength assuming a slope of β = 1.8. We see that the ALMA-FFs sources studied here exhibit a large dispersion in extent compared to brighter flux density sources; notably ~50% of the ALMA-FFs sources appear comparable to the largest literature sample sources. The dashed line shows the best fit regression to all samples, with log rs,demag = m × log F1.1 mm + b with m = −0.08 ± 0.10 and b = −0.95 ± 0.05. The orange shaded region shows the 2σ range of possible fits to the data. The measured sizes show no obvious trend with flux density.
Current usage metrics show cumulative count of Article Views (full-text article views including HTML views, PDF and ePub downloads, according to the available data) and Abstracts Views on Vision4Press platform.
Data correspond to usage on the plateform after 2015. The current usage metrics is available 48-96 hours after online publication and is updated daily on week days.
Initial download of the metrics may take a while.