Fig. 9

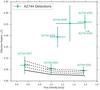
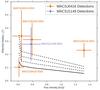
Measured effective radii rs as a function of flux density for the ALMA sources. We plot sources from A2744 (left) and MACS 0416+MACS 1149 (right) separately, since the latter have factors of ≈2 larger beam sizes. The solid black line in each plot corresponds to the average value of rs measured for simulated point sources ingested into the data. The dashed black lines likewise correspond to limits of 1, 2 and 3 times the standard deviation (σ) above the mean for simulated point sources, respectively, as a function of flux density. For visualization purposes, we only plot simulated lines for MACS J0416 in the right panel, noting that the limits for MACS J1149 are roughly identical. Additionally, A2744-ID02 is not shown in the left plot, since its flux density is much higher (~2.8 mJy) and it is clearly extended. Based on the criteria in Sect. 4.3, two sources are considered point-like, three sources are marginally extended, and seven are significantly extended.
Current usage metrics show cumulative count of Article Views (full-text article views including HTML views, PDF and ePub downloads, according to the available data) and Abstracts Views on Vision4Press platform.
Data correspond to usage on the plateform after 2015. The current usage metrics is available 48-96 hours after online publication and is updated daily on week days.
Initial download of the metrics may take a while.