Fig. 5
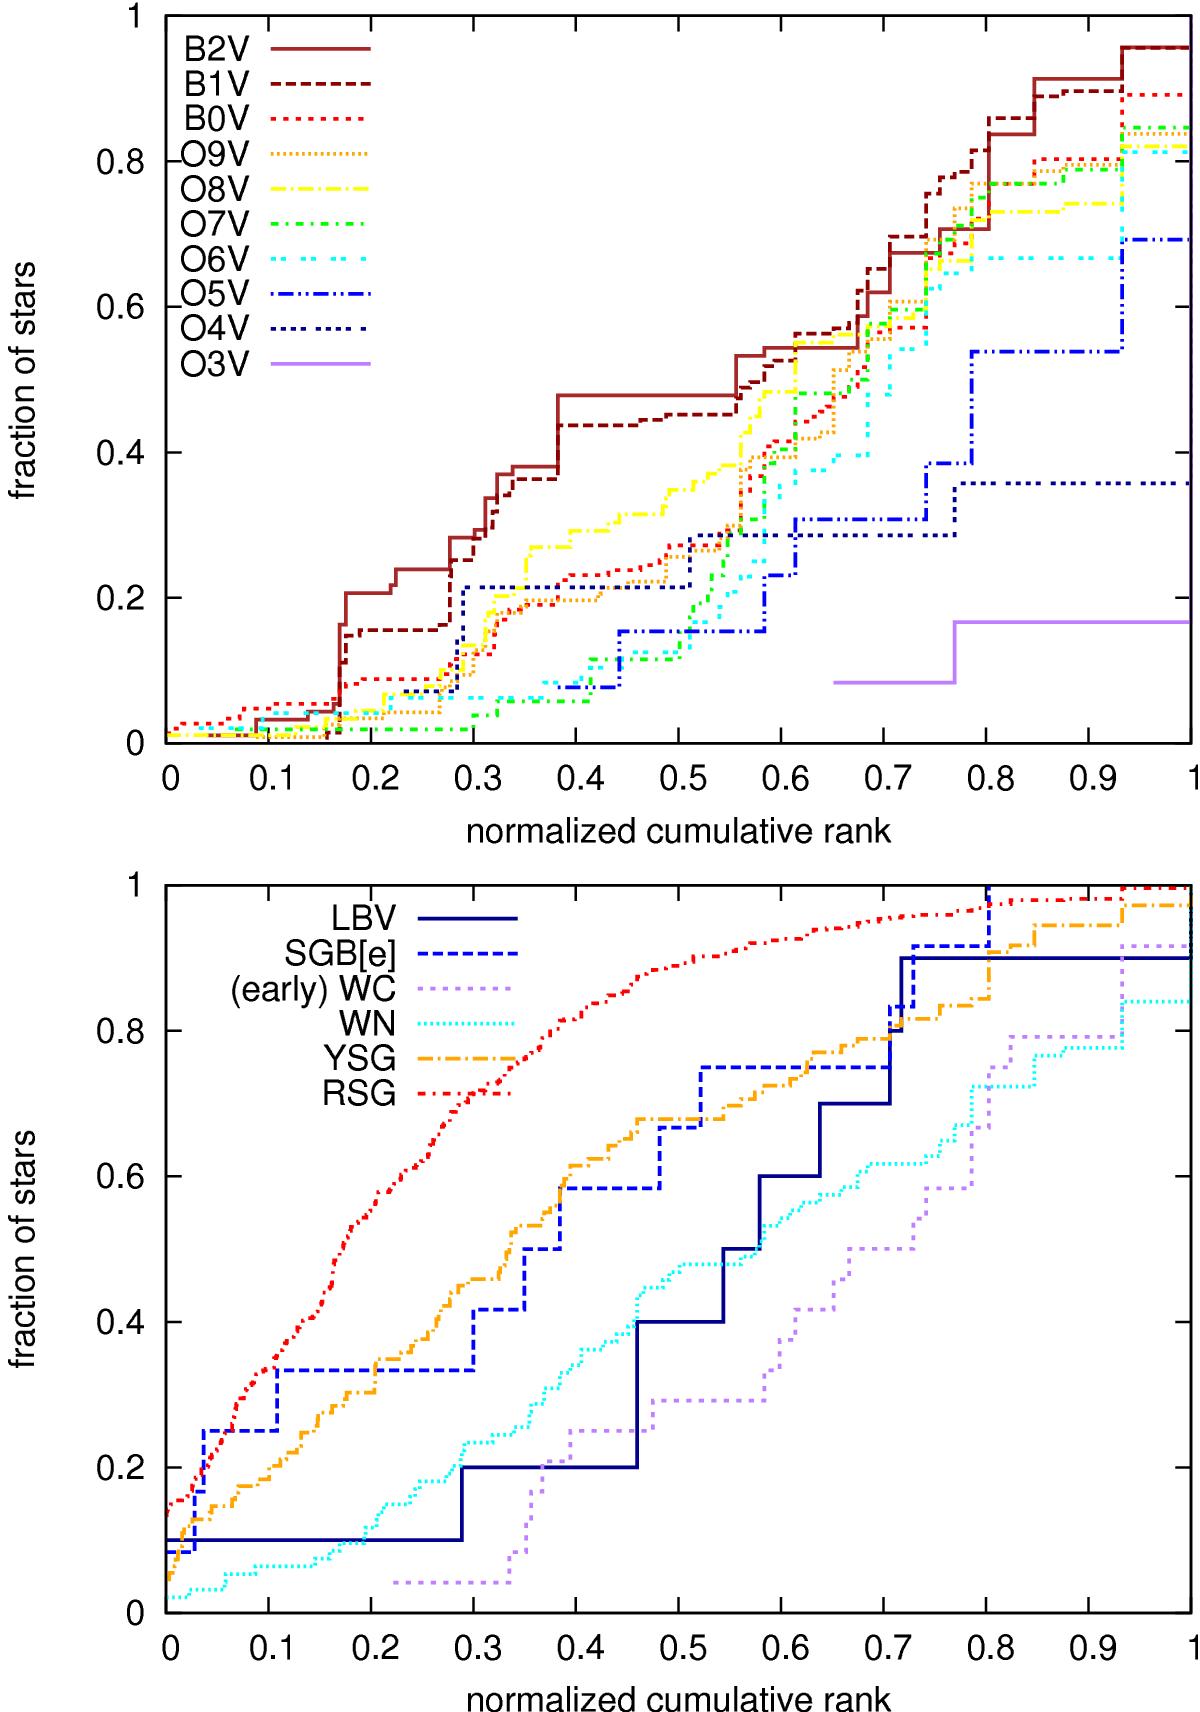
Top panel: cumulative NCR distributions of the main sequence stars of different spectral type in the LMC at a simulated distance of 35 Mpc, illustrating the trend of increasing NCR with earlier spectral type. Bottom panel: distributions of different types of evolved stars in the LMC at the distance of 35 Mpc, similarly illustrating the dependence of NCR on stellar type and hence initial mass. In both panels, shorter-lived stars tend toward the lower right and longer-lived stars toward the upper left.
Current usage metrics show cumulative count of Article Views (full-text article views including HTML views, PDF and ePub downloads, according to the available data) and Abstracts Views on Vision4Press platform.
Data correspond to usage on the plateform after 2015. The current usage metrics is available 48-96 hours after online publication and is updated daily on week days.
Initial download of the metrics may take a while.