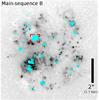
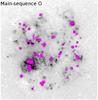
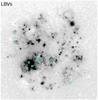
Fig. 3
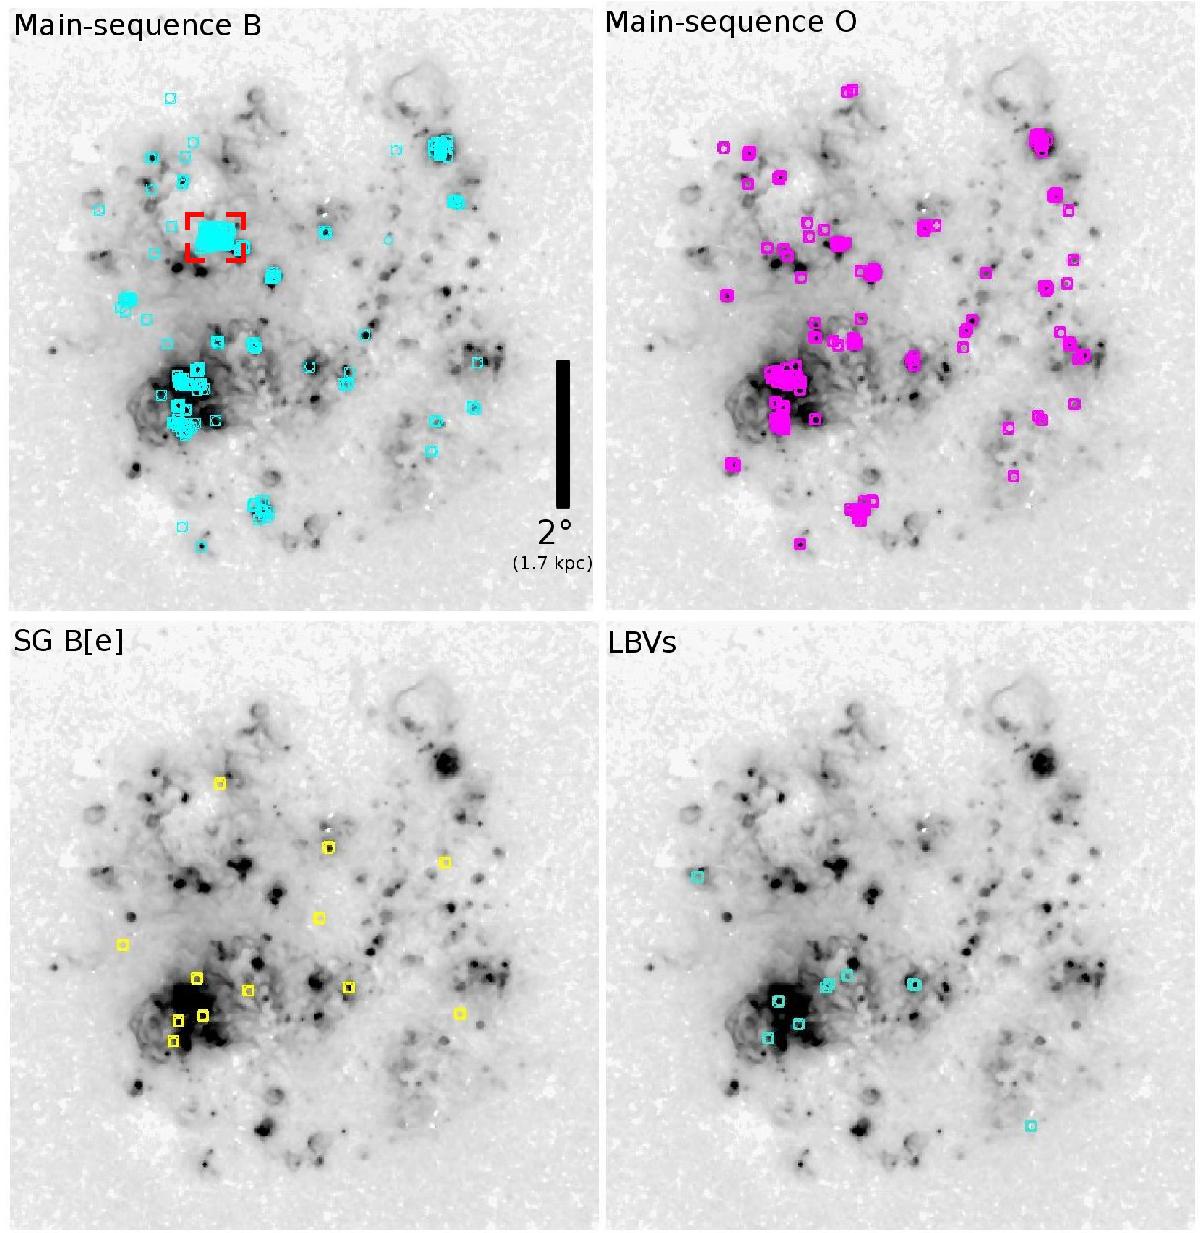
Hα images of the LMC, with our main-sequence B and O star samples as well as the SG B[e] stars and LBVs overplotted. A concentration of B stars is visible in a rectangular area (marked in red) with no strong Hα sources, indicating a spatial bias in this subsample (see also Sect. 6). The black scale bar corresponds to 2 deg (~1.7 kpc).
Current usage metrics show cumulative count of Article Views (full-text article views including HTML views, PDF and ePub downloads, according to the available data) and Abstracts Views on Vision4Press platform.
Data correspond to usage on the plateform after 2015. The current usage metrics is available 48-96 hours after online publication and is updated daily on week days.
Initial download of the metrics may take a while.