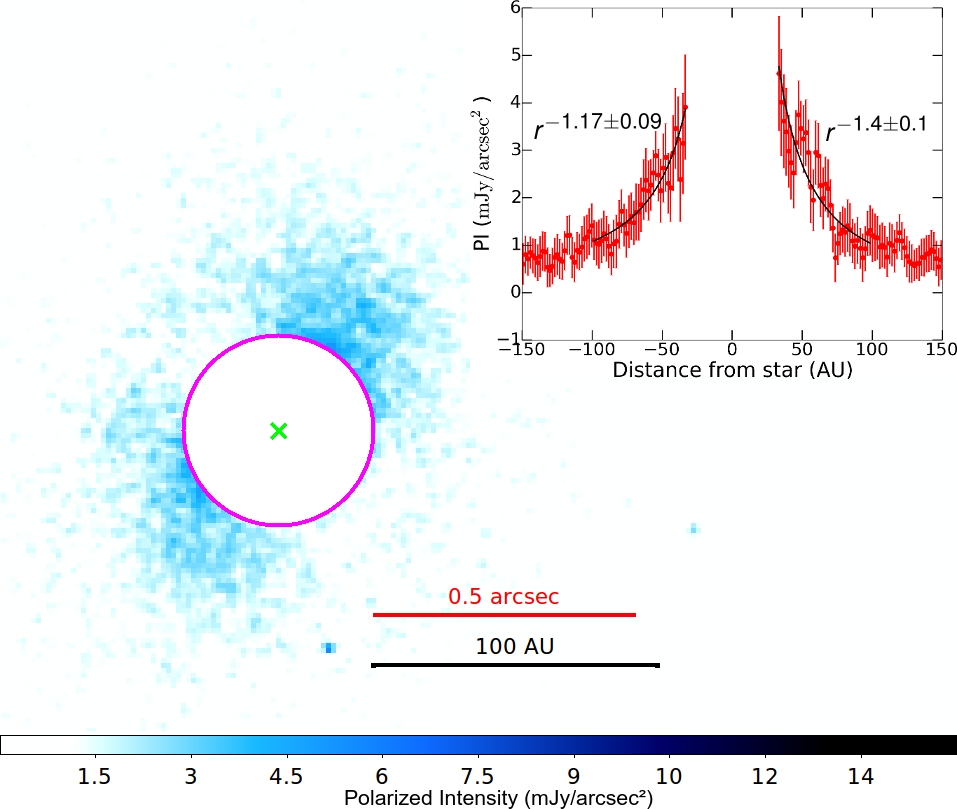
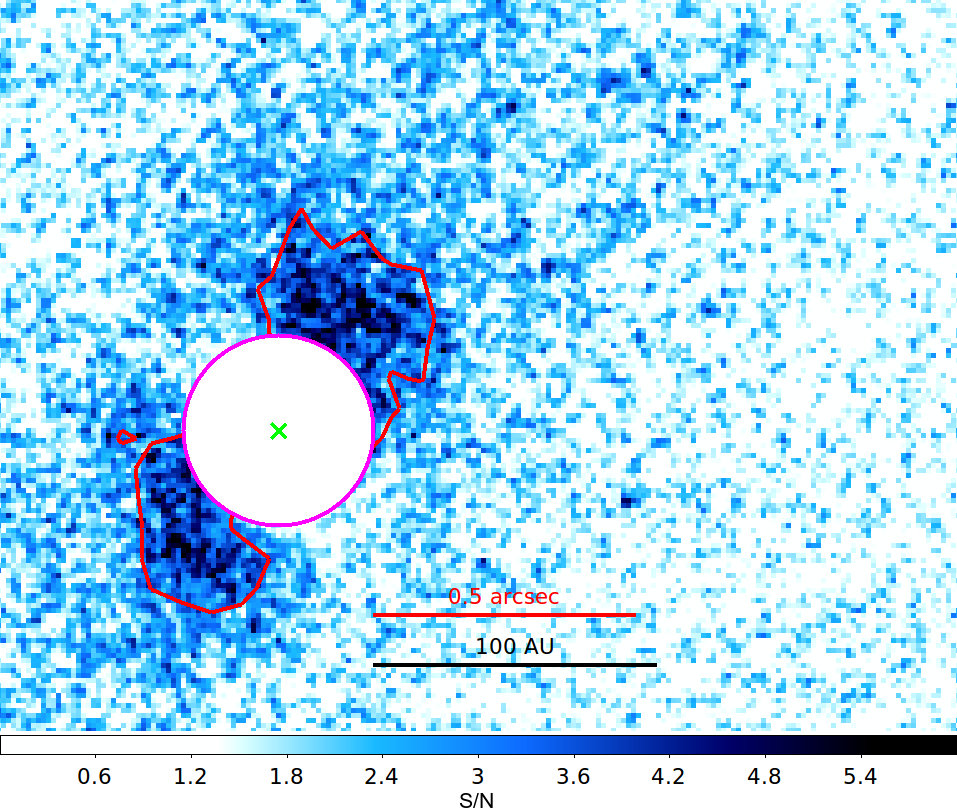
Fig. 2
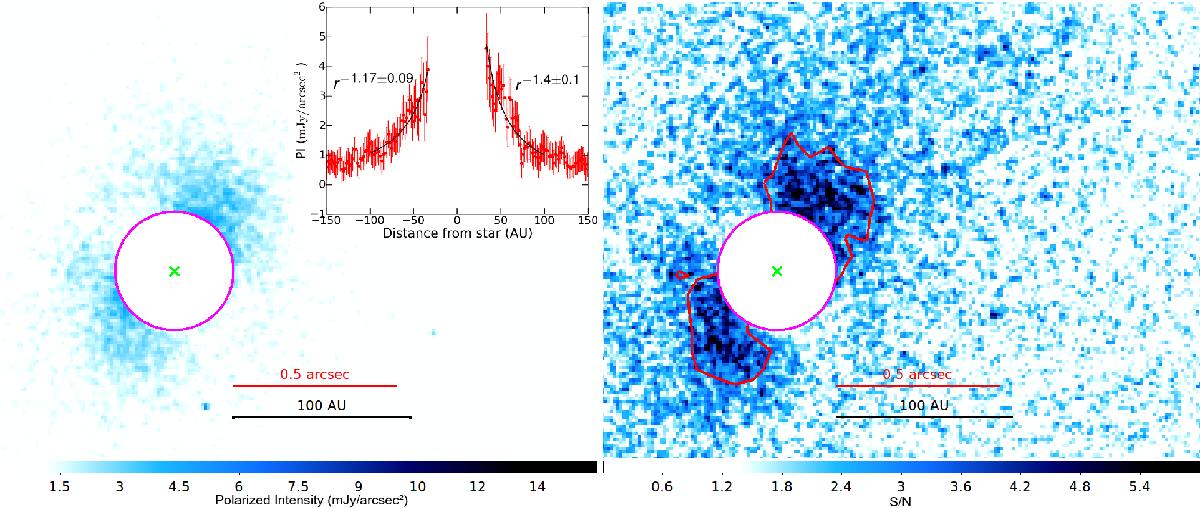
Polarized intensity map (left) and signal-to-noise map (right). The red contours show the S/N> 3 region, the green cross denotes the stellar position and the magenta circle gives the inner working angle of 33 AU. The region inside the inner working angle is masked. The plot gives the brightness profile along the disk major axis to which we fitted power-law profiles (black lines). The fitted power-law exponents are given in the plot with 1σ uncertainties.
Current usage metrics show cumulative count of Article Views (full-text article views including HTML views, PDF and ePub downloads, according to the available data) and Abstracts Views on Vision4Press platform.
Data correspond to usage on the plateform after 2015. The current usage metrics is available 48-96 hours after online publication and is updated daily on week days.
Initial download of the metrics may take a while.