Fig. 5
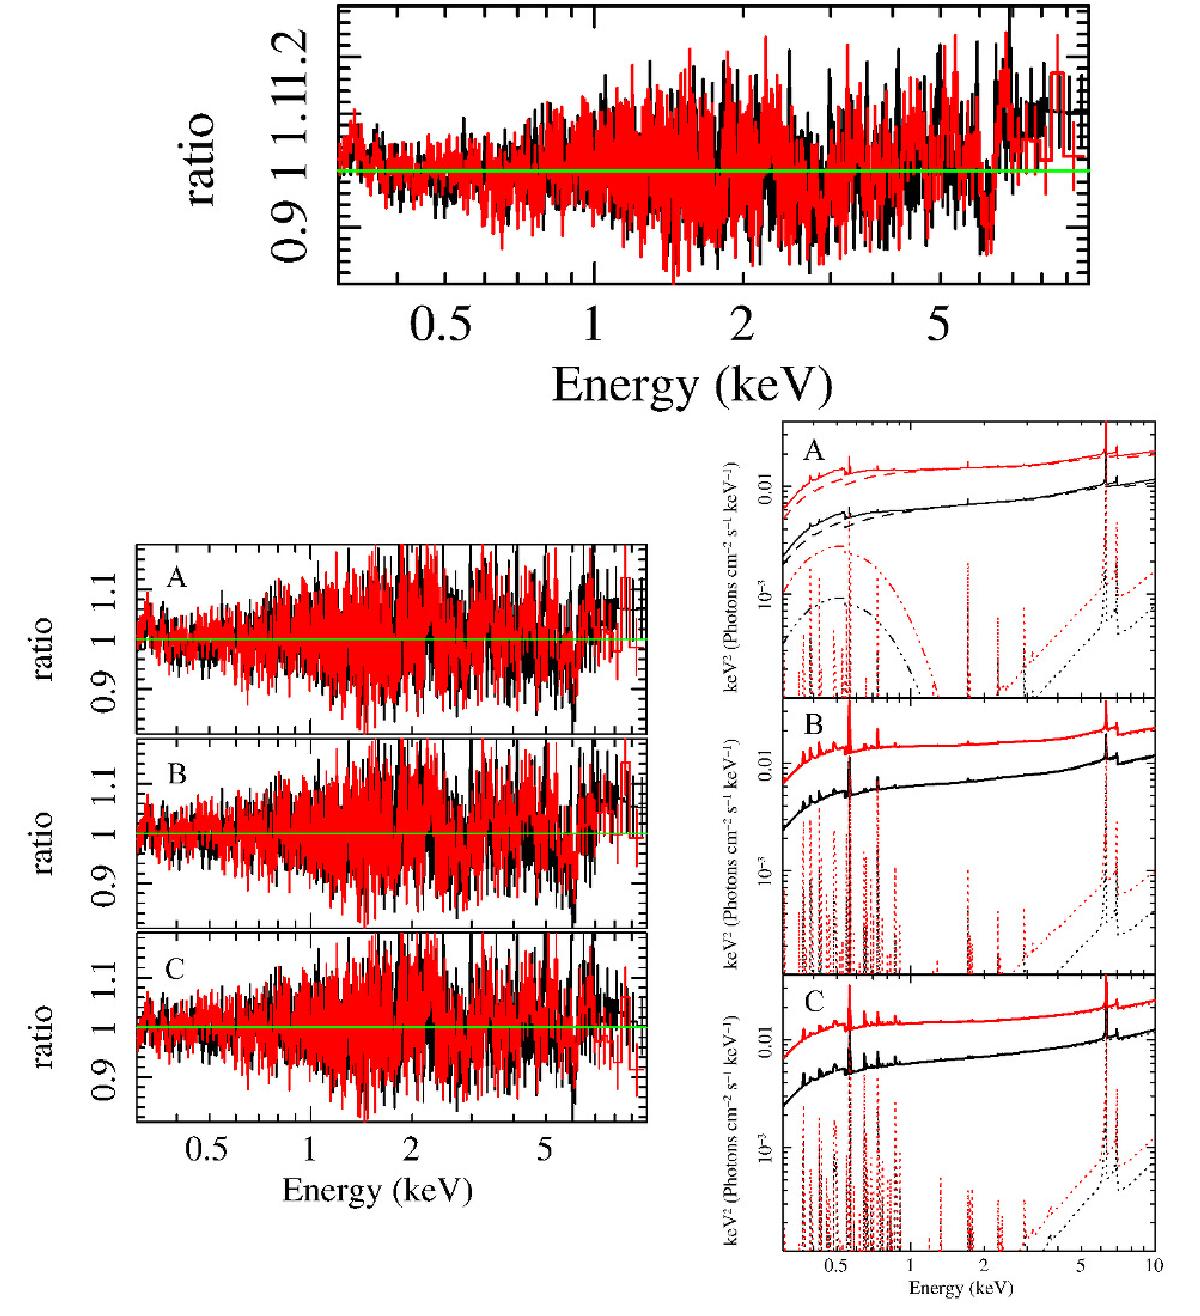
Top panel: EPIC-pn spectral residuals for our baseline model xillver + tbnew_pcf*(blackbody + power law) fitted in the 0.3–10 keV band, for OBS1 (black) and OBS2 (red). Top left panel, Model A: spectral residuals after the addition of a cold partially covering absorber, xillver + tbnew_pcf*(blackbody + power law). Middle left panel, Model B: spectral residuals for a double partial covering absorber model, xillver + tbnew_pcf1*tbnew_pcf2*powerlaw. Bottom left panel, Model C: spectral residuals for a double Comptonisation model, xillver + tbnew_pcf*(optxagnf). Data were visually rebinned to a significance of 15σ (Xspec command setplot rebin). Top right panel: theoretical model A; middle right panel: theoretical model B; bottom right panel: theoretical model C. Black lines always refer to OBS1, and red lines to OBS2.
Current usage metrics show cumulative count of Article Views (full-text article views including HTML views, PDF and ePub downloads, according to the available data) and Abstracts Views on Vision4Press platform.
Data correspond to usage on the plateform after 2015. The current usage metrics is available 48-96 hours after online publication and is updated daily on week days.
Initial download of the metrics may take a while.