Fig. 5
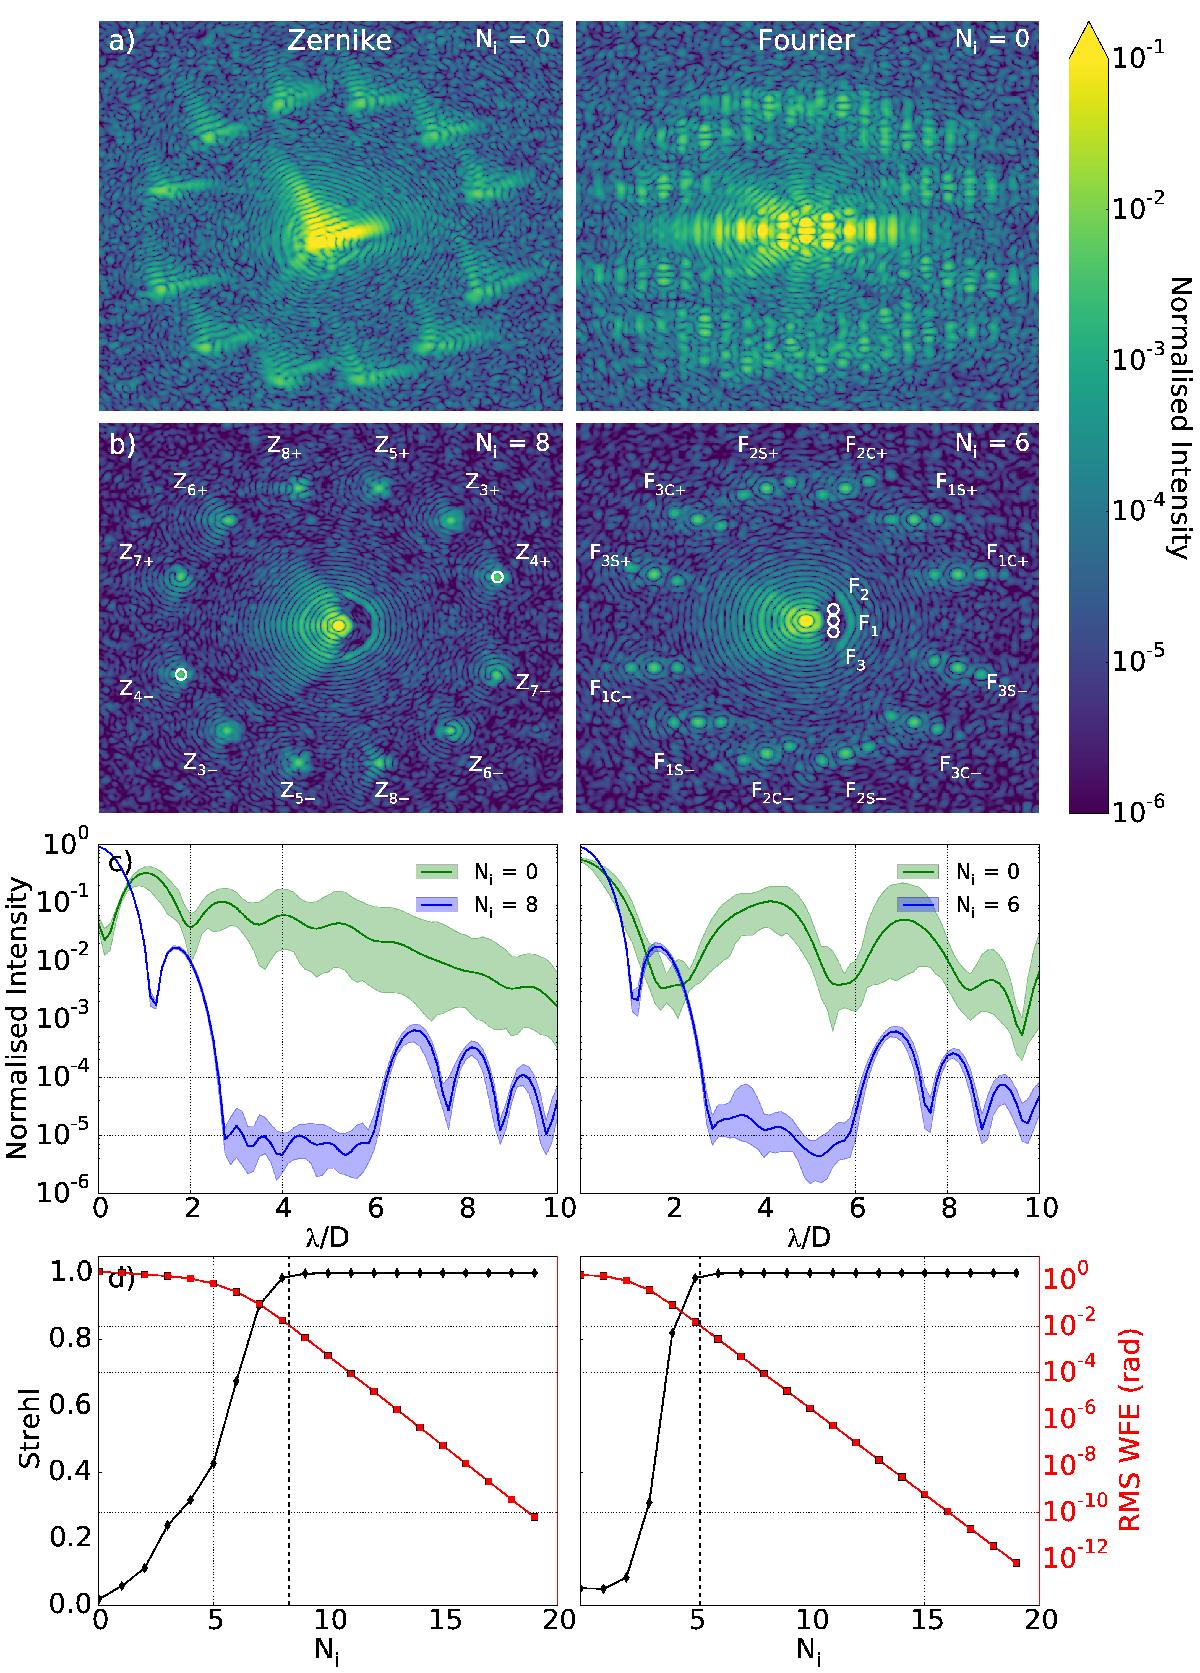
Example closed-loop performance for a 6-mode Zernike (left column) and Fourier (right column) mode cMWS for g = 0.8. a) Ni = 0 aberrated PSFs, with ak = 1.0 radians rms per mode. b) Diffraction-limited PSF after Ni closed-loop iterations required to achieve convergence. PSF copies corresponding to each mode bias are labelled Zn ± for Zernike modes and FnS/C ± for Fourier modes, where the index S/C denote the sine and cosine mode phases respectively, and mode number corresponds to the circled regions of influence in the APP dark hole. The white circles overlaid on the Z4 ± modes indicated the r = 1.22λ/D region of interest used for wavefront measurement. Note also the differing angular extent of each APP, which cover 180° and 90° for the Zernike/Fourier designs respectively. c) Azimuthally-averaged residual intensity plots corresponding to the PSFs of panels a) (green) and b) (blue); shaded regions denote 1σ variance averaged over the APP dark hole. d) Science PSF Strehl ratio (black diamonds) and residual rms wavefront error (red squares) as a function of iteration number Ni. Vertical dashed lines indicate the point of convergence.
Current usage metrics show cumulative count of Article Views (full-text article views including HTML views, PDF and ePub downloads, according to the available data) and Abstracts Views on Vision4Press platform.
Data correspond to usage on the plateform after 2015. The current usage metrics is available 48-96 hours after online publication and is updated daily on week days.
Initial download of the metrics may take a while.