Free Access
Fig. 4
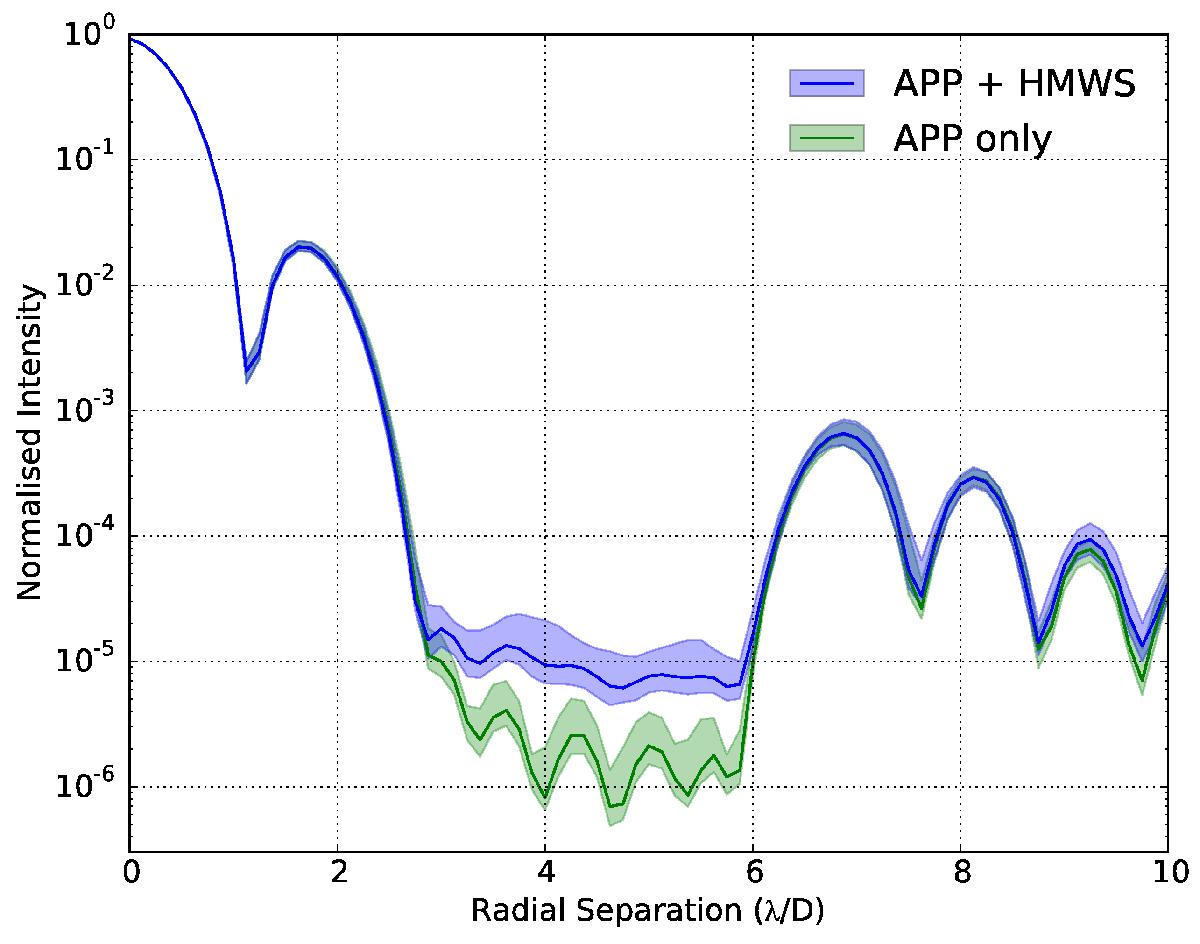
Contrast curves for the APP coronagraph presented in Fig. 3, with (blue) and without (green) the HMWS hologram. The shaded regions denote the 1-sigma variance limit of residual structure at each radius, azimuthally averaged over a 170 degree region corresponding to the dark hole contrast floor.
Current usage metrics show cumulative count of Article Views (full-text article views including HTML views, PDF and ePub downloads, according to the available data) and Abstracts Views on Vision4Press platform.
Data correspond to usage on the plateform after 2015. The current usage metrics is available 48-96 hours after online publication and is updated daily on week days.
Initial download of the metrics may take a while.