Fig. 11
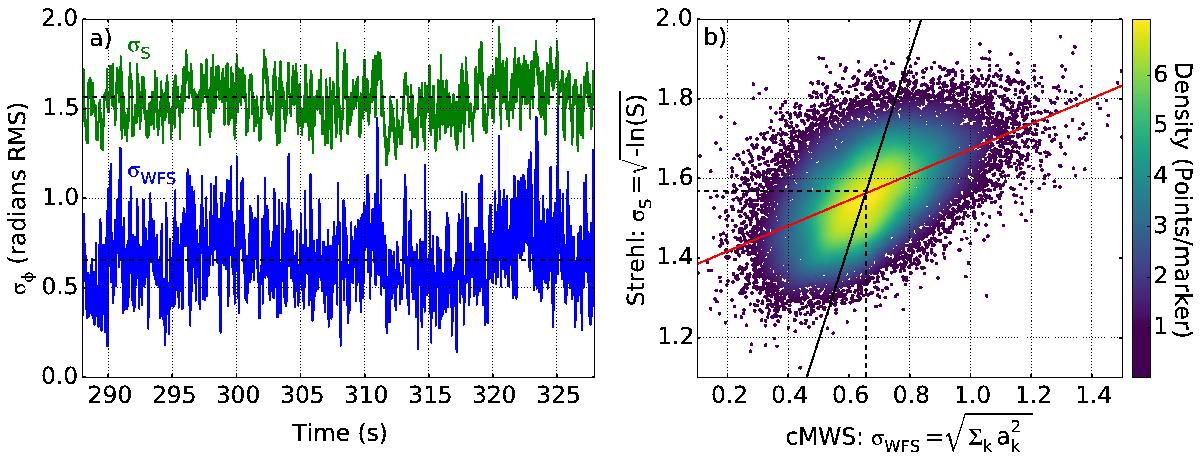
a) Time series of single-frame rms wavefront error σφ as measured by i) the central PSF Strehl ratio under the Maréchal approximation (σS, green) and ii) calibrated cMWS measurements (σWFS, blue). Slow variations in seeing quality seen in σS are visibly traced by the sensor. b) Correlation plot between the two independent estimates of rms wavefront error, with colour indicating point density. The solid black line denotes σS/σWFS = 0.45 as is expected theoretically from Noll (1976), which corresponds well to the core regions of the correlation (1.45 < σS < 1.65). The outer regions have a significantly shallower gradient (red), distorted by various systematic error sources.
Current usage metrics show cumulative count of Article Views (full-text article views including HTML views, PDF and ePub downloads, according to the available data) and Abstracts Views on Vision4Press platform.
Data correspond to usage on the plateform after 2015. The current usage metrics is available 48-96 hours after online publication and is updated daily on week days.
Initial download of the metrics may take a while.