Fig. 9
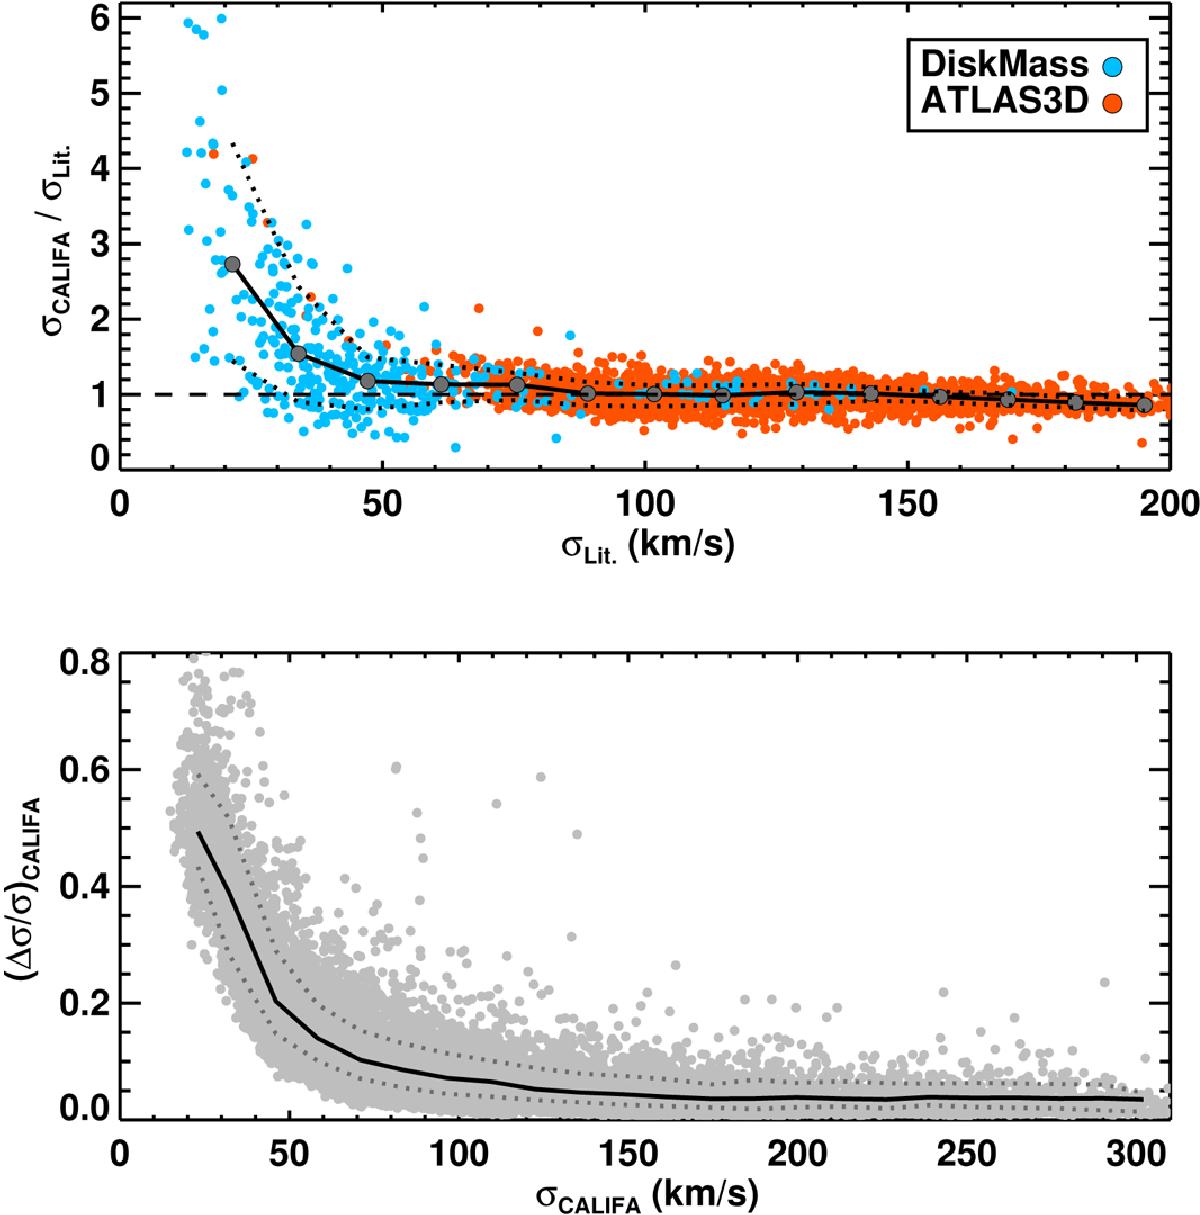
Characterization of the biases and relative uncertainties in the velocity dispersions of the CALIFA survey. Top panel: ratio between the CALIFA and DMS/ATLAS3D measurements at the locations of the DMS/ATLAS3D values (see Sect. 5.2 for details). Bottom panel: relative uncertainties in the velocity dispersion values of the CALIFA survey using the Voronoi values and uncertainties for all the galaxies presented here. In both panels, the area delimited by the dotted lines indicates the 16% and 84% percentiles of the distribution of gray points. The solid lines and gray points indicate the median of the distributions.
Current usage metrics show cumulative count of Article Views (full-text article views including HTML views, PDF and ePub downloads, according to the available data) and Abstracts Views on Vision4Press platform.
Data correspond to usage on the plateform after 2015. The current usage metrics is available 48-96 hours after online publication and is updated daily on week days.
Initial download of the metrics may take a while.