Fig. 7
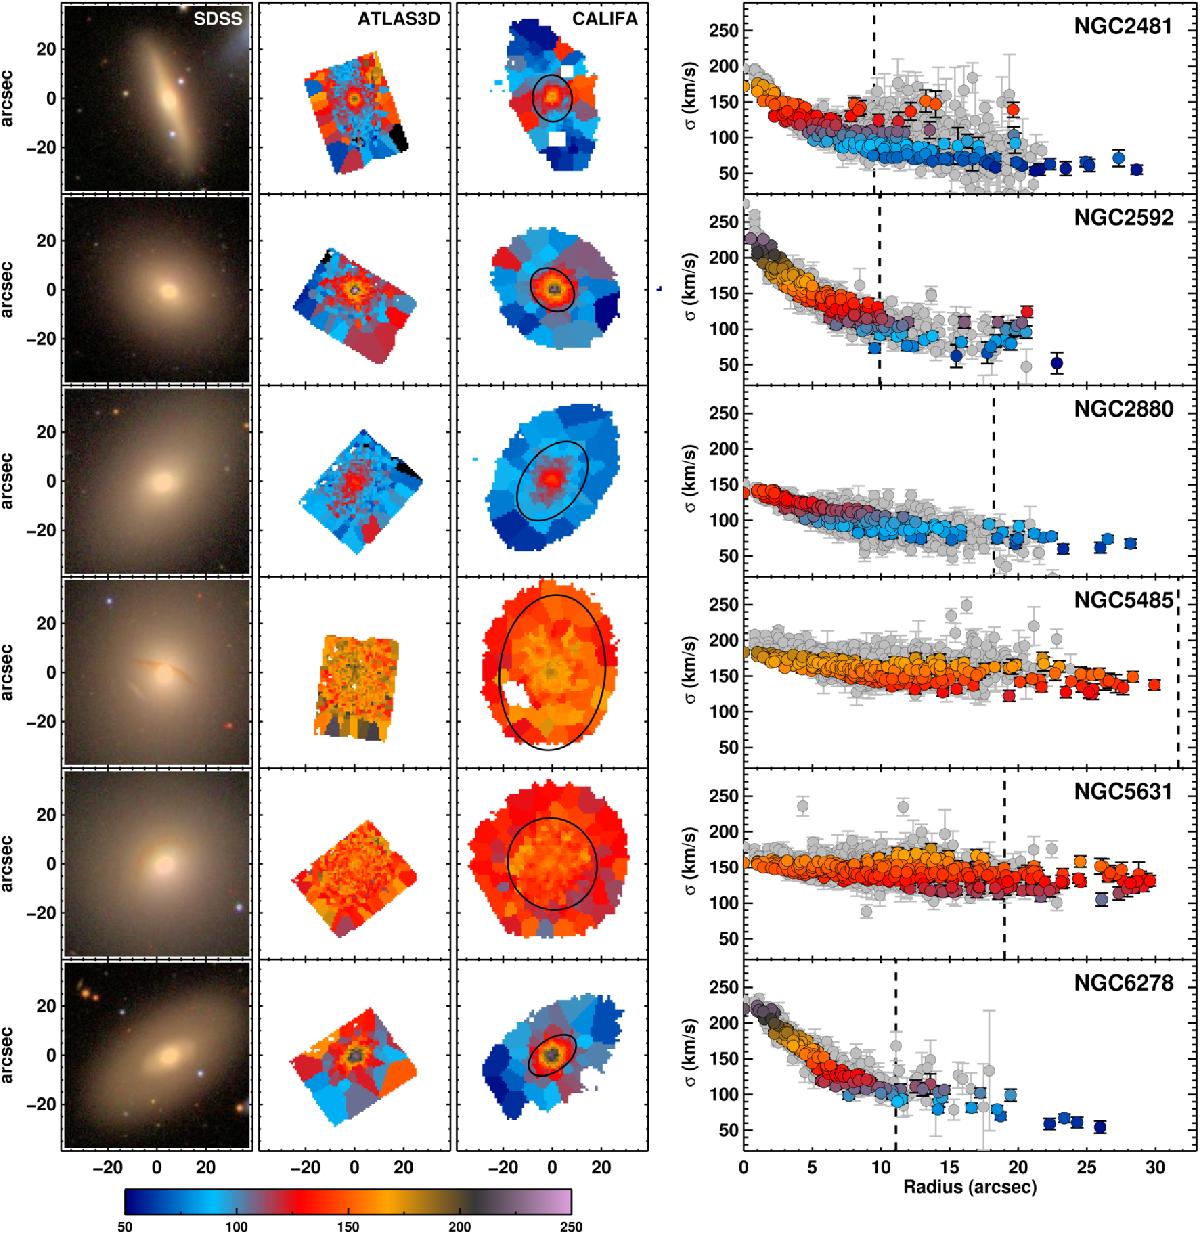
Comparison of the stellar velocity dispersion maps and radial profiles from the CALIFA and ATLAS3D surveys. Each row shows (from left to right): a color-composite SDSS image of the galaxy, the ATLAS3D velocity dispersion map, the CALIFA velocity dispersion map, and the radial velocity dispersion profile (extracted in circular apertures). ATLAS3D measurements are in gray while the CALIFA measurements are in color following the same color scheme of the maps (also indicated with the colorbar below). The black ellipse in the maps indicates one effective radius in those galaxies. This is also indicated in the radial profile panels with a dashed vertical line. Empty (i.e., white) regions within some of the CALIFA maps are areas masked during our kinematic extraction. All velocity dispersion measurements are expressed in km s-1.
Current usage metrics show cumulative count of Article Views (full-text article views including HTML views, PDF and ePub downloads, according to the available data) and Abstracts Views on Vision4Press platform.
Data correspond to usage on the plateform after 2015. The current usage metrics is available 48-96 hours after online publication and is updated daily on week days.
Initial download of the metrics may take a while.