Fig. 2
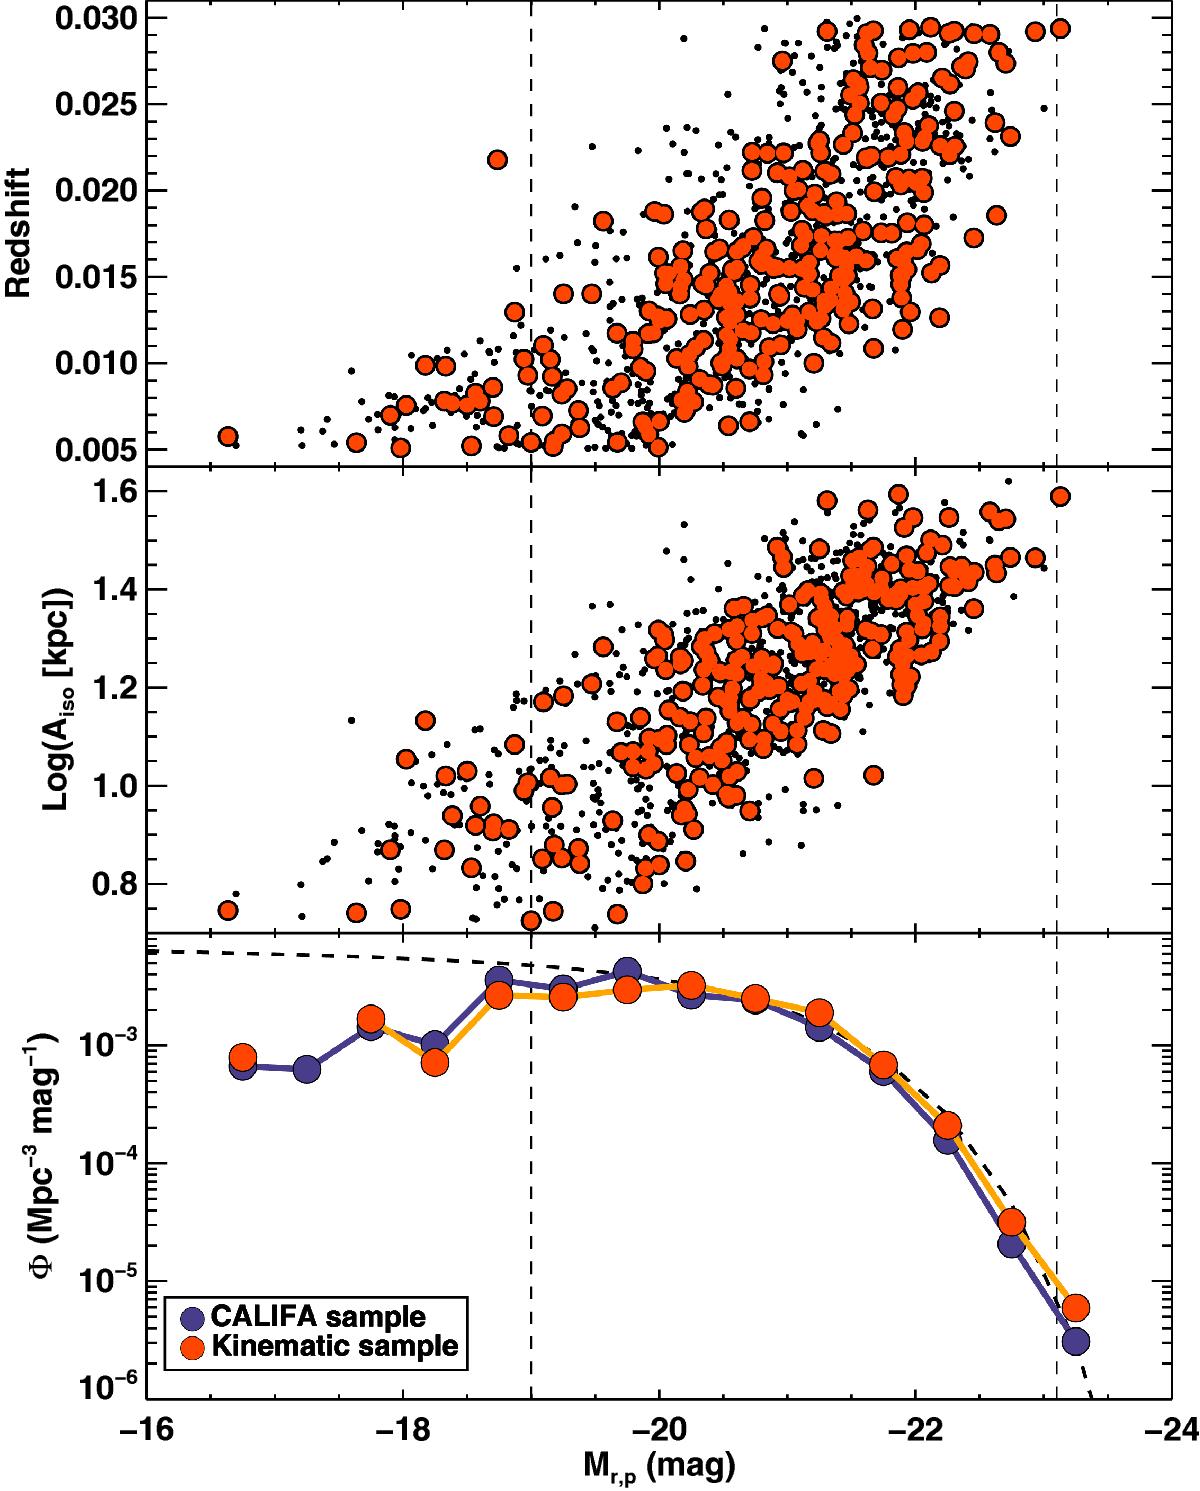
Top and middle panels: distribution of our sample of 300 galaxies (orange circles) in redshift, isophotal diameter (Aiso), and absolute r-band petrosian magnitude (Mr,p). For reference, the CALIFA mother sample is shown with black dots. The vertical lines indicate the limits in absolute magnitude in which the CALIFA mother sample is representative. Bottom panel: comparison of the luminosity functions of the SDSS (Blanton et al. 2003, thick dashed line), CALIFA mother sample (dark blue circles), and the kinematic sample presented here (orange circles).
Current usage metrics show cumulative count of Article Views (full-text article views including HTML views, PDF and ePub downloads, according to the available data) and Abstracts Views on Vision4Press platform.
Data correspond to usage on the plateform after 2015. The current usage metrics is available 48-96 hours after online publication and is updated daily on week days.
Initial download of the metrics may take a while.