Free Access
Fig. 1
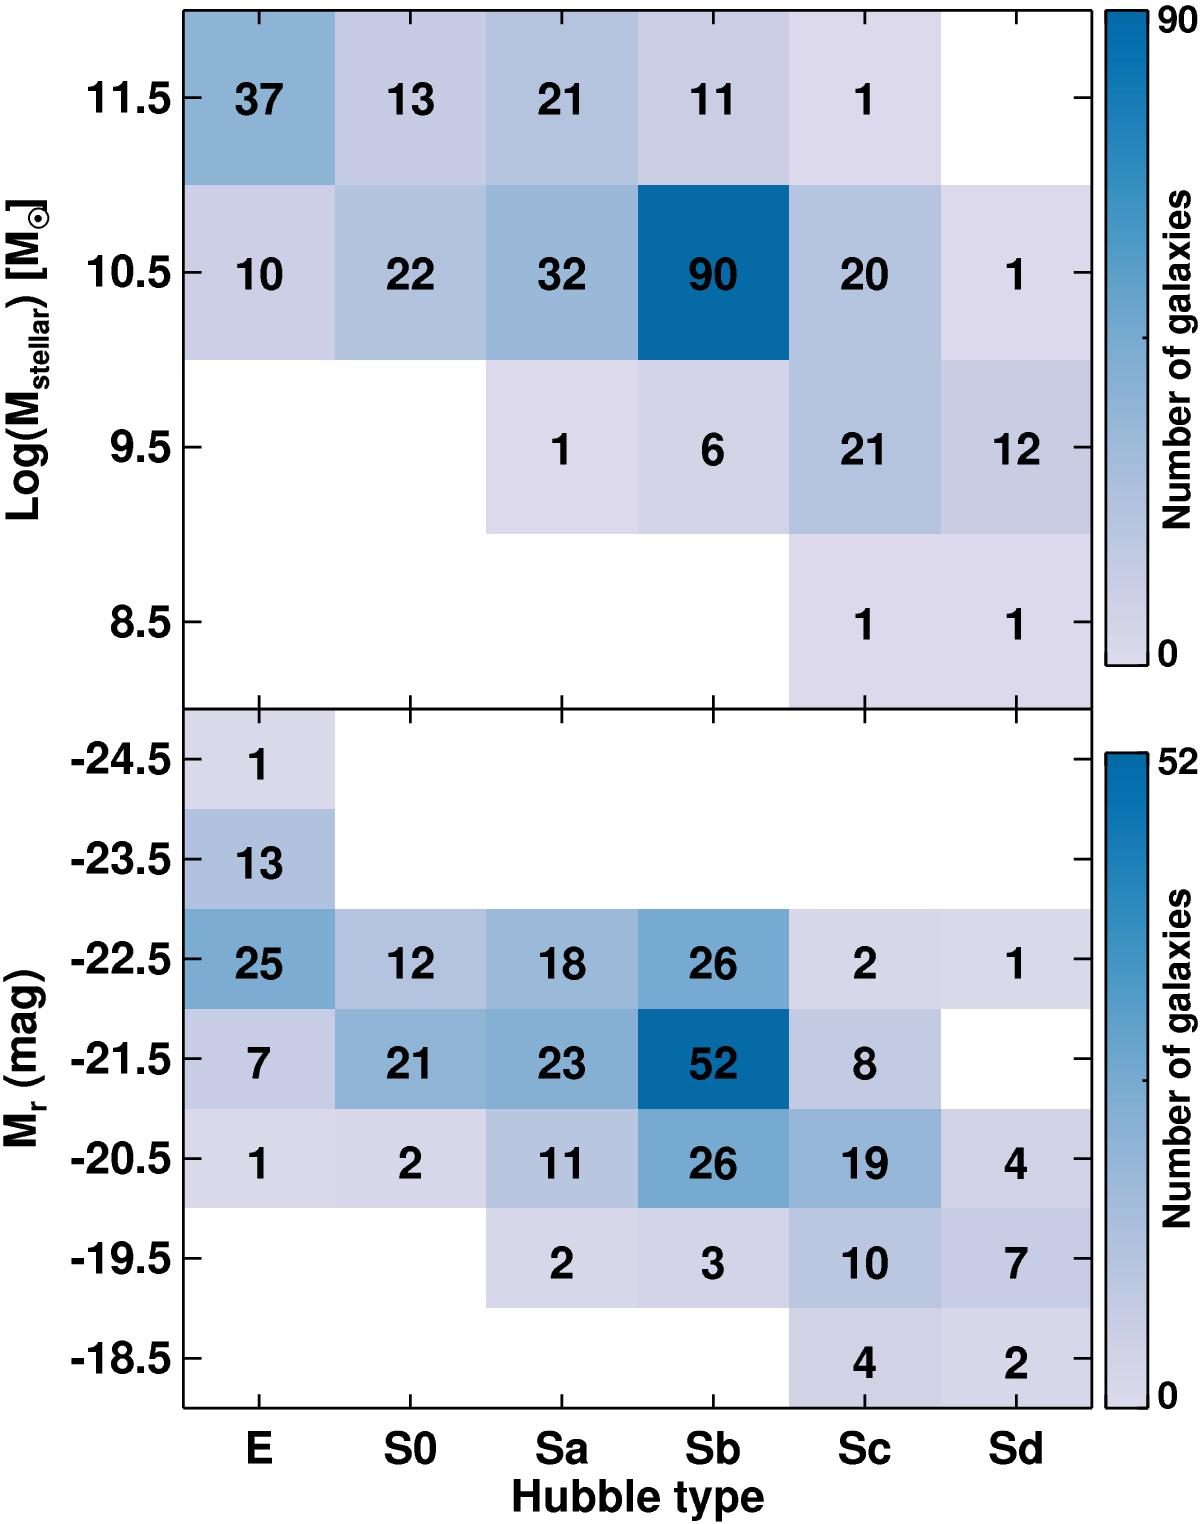
Distribution of galaxies in the sample of CALIFA galaxies presented in this paper (see Sect. 2) as a function of Hubble type, stellar mass, and absolute magnitude in the r-band. For convenience, along with the color bar, we indicate the number of galaxies in each bin.
Current usage metrics show cumulative count of Article Views (full-text article views including HTML views, PDF and ePub downloads, according to the available data) and Abstracts Views on Vision4Press platform.
Data correspond to usage on the plateform after 2015. The current usage metrics is available 48-96 hours after online publication and is updated daily on week days.
Initial download of the metrics may take a while.