Fig. 2
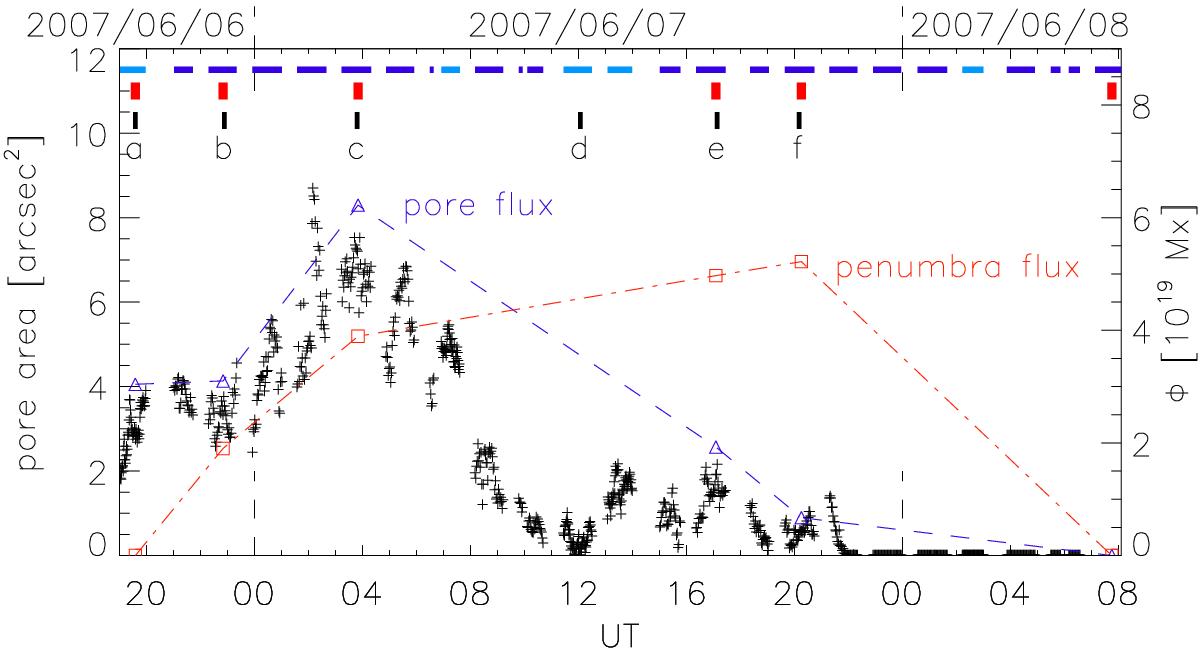
Evolution of the pore area with ![]() (black + symbols). Blue △ symbols connected by the dashed line show the total positive magnetic flux (Φ) in the pore. Red Λ symbols connected by the dash-doted line show Φ in the penumbra. The horizontal blue lines at the top of the plot indicate the times of G-band observations, where the light blue correspond to the imaging cadence of 60 s. The vertical red lines correspond to the times of SP scans and the vertical black lines labelled a)–f) show the times of images shown in Figs. 1, 3, and 4.
(black + symbols). Blue △ symbols connected by the dashed line show the total positive magnetic flux (Φ) in the pore. Red Λ symbols connected by the dash-doted line show Φ in the penumbra. The horizontal blue lines at the top of the plot indicate the times of G-band observations, where the light blue correspond to the imaging cadence of 60 s. The vertical red lines correspond to the times of SP scans and the vertical black lines labelled a)–f) show the times of images shown in Figs. 1, 3, and 4.
Current usage metrics show cumulative count of Article Views (full-text article views including HTML views, PDF and ePub downloads, according to the available data) and Abstracts Views on Vision4Press platform.
Data correspond to usage on the plateform after 2015. The current usage metrics is available 48-96 hours after online publication and is updated daily on week days.
Initial download of the metrics may take a while.