Free Access
Fig. 1
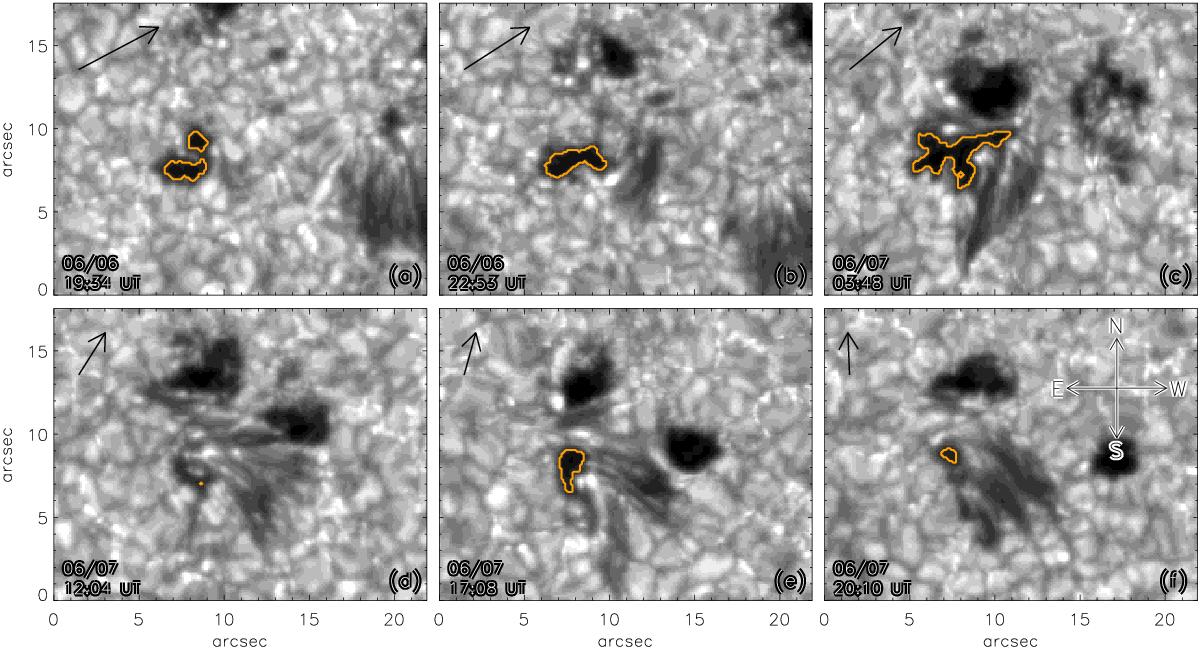
G-band images showing selected stages of pore and penumbra evolution in AR 10960. The orange contours indicate pore areas with ![]() . The arrows point towards the disc centre (north is up and west is right as marked in f)). A video showing the temporal evolution of the penumbra at the pore boundary is available online.
. The arrows point towards the disc centre (north is up and west is right as marked in f)). A video showing the temporal evolution of the penumbra at the pore boundary is available online.
Current usage metrics show cumulative count of Article Views (full-text article views including HTML views, PDF and ePub downloads, according to the available data) and Abstracts Views on Vision4Press platform.
Data correspond to usage on the plateform after 2015. The current usage metrics is available 48-96 hours after online publication and is updated daily on week days.
Initial download of the metrics may take a while.