Fig. 8
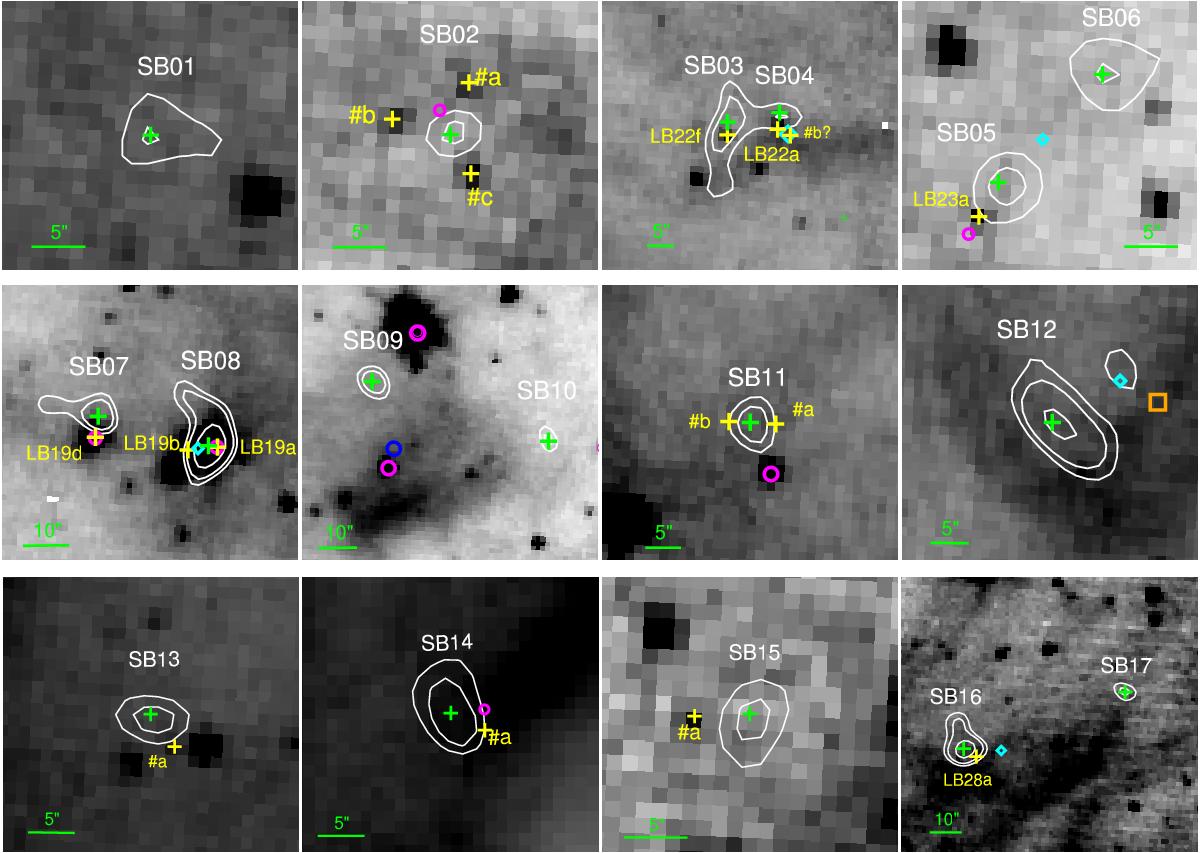
Spitzer IRAC 3.6 μm finding charts with the APEX/SABOCA detections, except for SB14 (IRAC 8 μm image). North is up and east to the left. The green crosses represent the coordinates of the peak emission of the APEX/SABOCA detections. The white contours represent the APEX/SABOCA emission at 2.5, 3, 4 and 5σ level. The infrared counterparts within a radius of 5.̋3 (half of the APEX/SABOCA beam) are represented by yellow crosses. If previously discussed by BGH16, they are named with the APEX/LABOCA designation. If not, they are named with low-case letters. The magenta circles represent WISE detections, the cyan diamonds represent the position of the APEX/LABOCA cores peak intensity, and the blue circles indicate AKARI detections. The orange square represents a Planck detection (see text).
Current usage metrics show cumulative count of Article Views (full-text article views including HTML views, PDF and ePub downloads, according to the available data) and Abstracts Views on Vision4Press platform.
Data correspond to usage on the plateform after 2015. The current usage metrics is available 48-96 hours after online publication and is updated daily on week days.
Initial download of the metrics may take a while.