Fig. 6
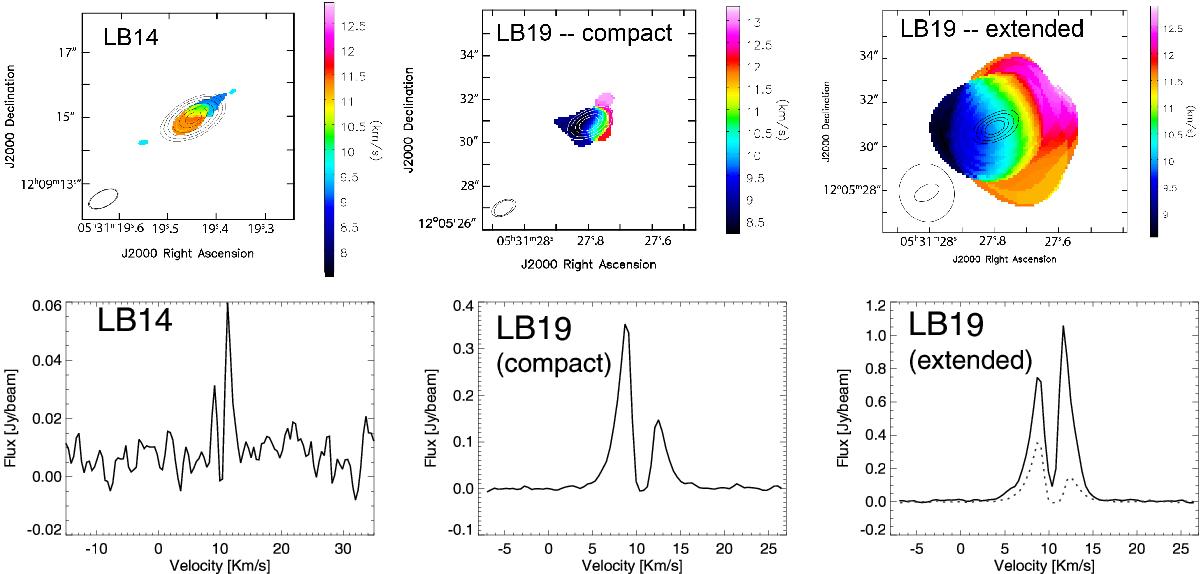
Top panels: ALMA CO(3–2) intensity weighted velocity field (first order moment, color scale) with the ALMA 880 micron continuum emission over-plotted in contours. The left panel corresponds to LB14, while the middle and right panels correspond to the compact and extended emission of LB19, respectively. For LB14, contours are 5, 10, 20, 40, 80, and 120 times the rms noise of the map, 0.25 mJy/beam. For LB19, contours are 5, 10, 20, and 30 times the rms noise of the map, 0.20 mJy/beam. Ellipses at the bottom left represent the synthesized beam for the continuum and for the CO(3–2) maps. In the case of LB19, the beam for the CO(3–2) image corresponds to emission at >60 Kλ (central panel), and <60 Kλ (right panel). Bottom panels: CO(3–2) spectrum in the region of emission of LB14 (left), and in the compact (middle) and extended (right) regions of emission of LB19. In the last panel both the compact (dotted line) and extended emission (solid line) are superimposed for comparison.
Current usage metrics show cumulative count of Article Views (full-text article views including HTML views, PDF and ePub downloads, according to the available data) and Abstracts Views on Vision4Press platform.
Data correspond to usage on the plateform after 2015. The current usage metrics is available 48-96 hours after online publication and is updated daily on week days.
Initial download of the metrics may take a while.