Fig. 5
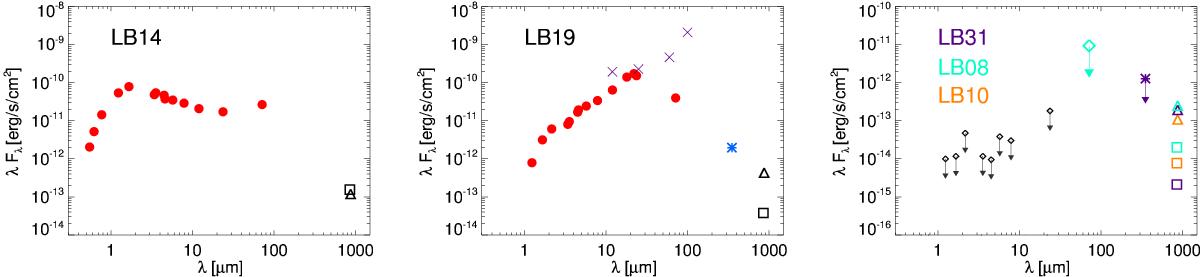
Observed SEDs of the five ALMA detections. In all the panels, the open triangles and squares represent the APEX/LABOCA and ALMA fluxes, respectively, while the asterisks represent the APEX/SABOCA data. Left and middle panels: we show the complete SEDs of LB14 and LB19. The red circles represent optical to mid-IR data from all our catalogues whenever available (see Sect. 2.3). The purple crosses in the LB19 panel represent IRAS data. Right panel: three ALMA detections with no infrared counterparts: LB08, LB10 and LB31. The APEX/LABOCA and ALMA detections are color-coded for each source. We have included the limiting magnitudes (black diamonds) of our infrared data.
Current usage metrics show cumulative count of Article Views (full-text article views including HTML views, PDF and ePub downloads, according to the available data) and Abstracts Views on Vision4Press platform.
Data correspond to usage on the plateform after 2015. The current usage metrics is available 48-96 hours after online publication and is updated daily on week days.
Initial download of the metrics may take a while.