Fig. 4
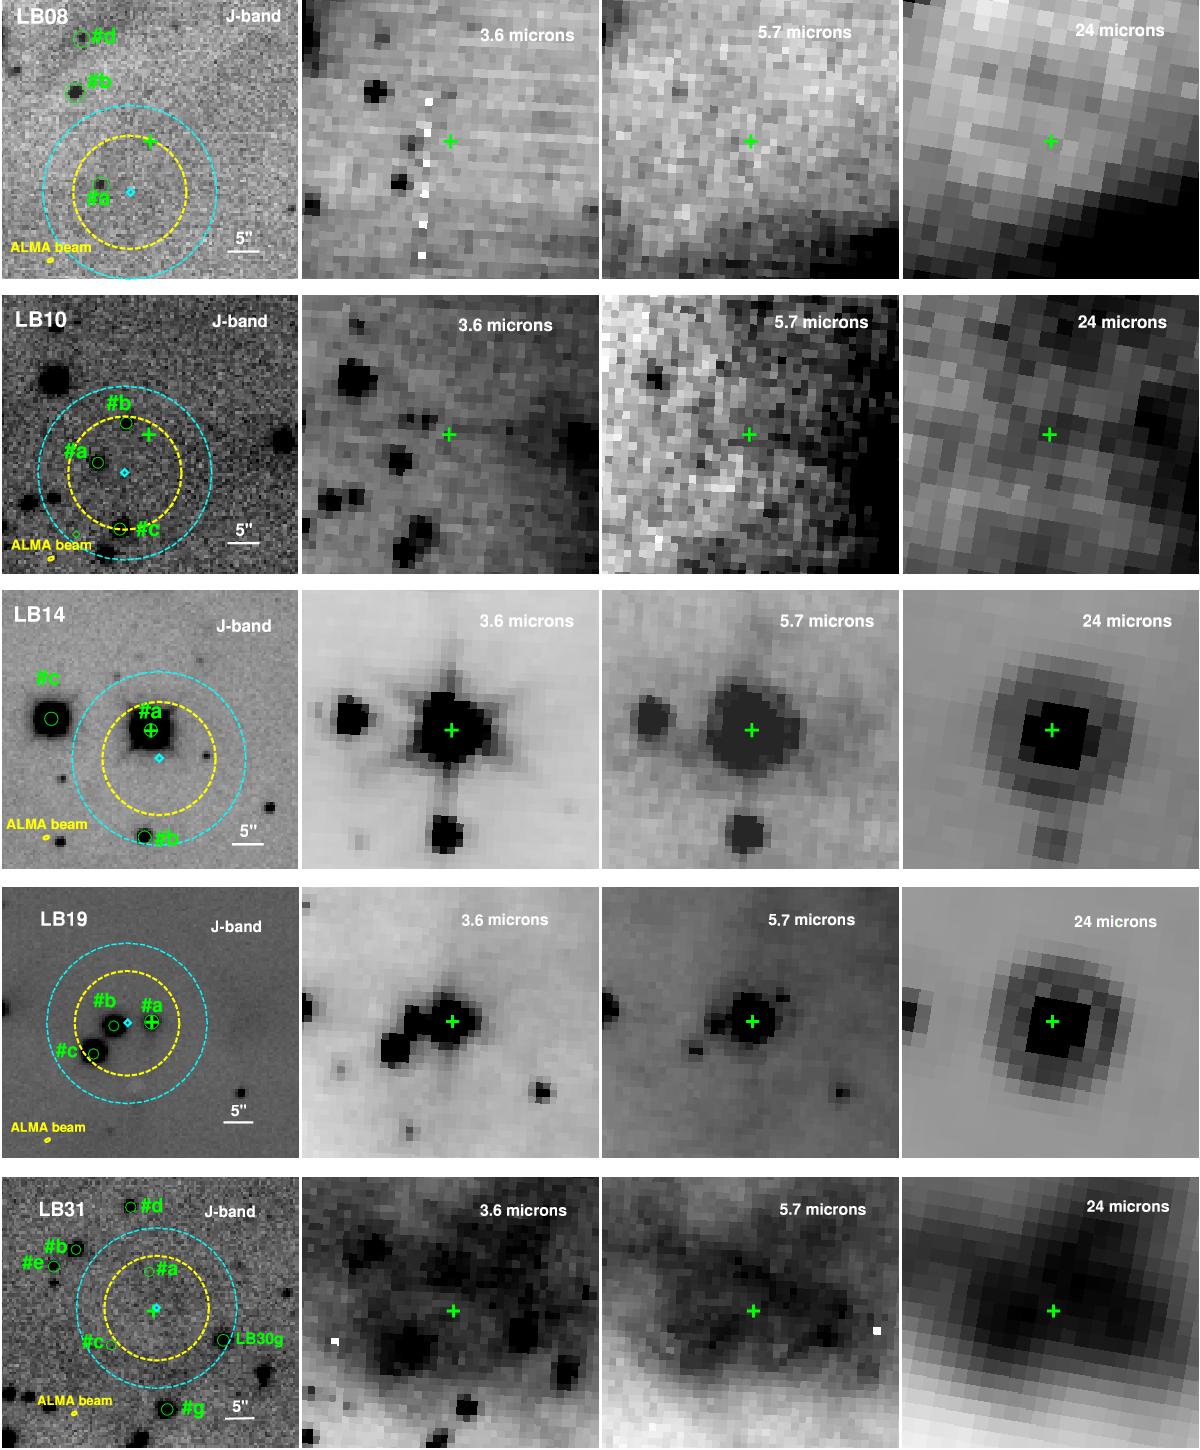
Infrared (CAHA/O2000 and Spitzer/IRAC and MIPS) images centered on the ALMA detection coordinates. North is up and east to the left. We have included in all the J-band images (left panels) the position of the ALMA detections (green crosses), and the possible infrared counterparts to the APEX/LABOCA detections identified by BGH16 (green labels). The cyan diamonds represent the APEX/LABOCA peak intensity coordinates (ALMA phase center coordinates).We have also plotted the APEX/LABOCA beam of 13.8′′ radius (cyan dashed circle), the ALMA FOV of ~18′′ diameter (yellow dashed circle), and the ALMA beam at the bottom left corner (yellow solid ellipse).
Current usage metrics show cumulative count of Article Views (full-text article views including HTML views, PDF and ePub downloads, according to the available data) and Abstracts Views on Vision4Press platform.
Data correspond to usage on the plateform after 2015. The current usage metrics is available 48-96 hours after online publication and is updated daily on week days.
Initial download of the metrics may take a while.