Fig. 1
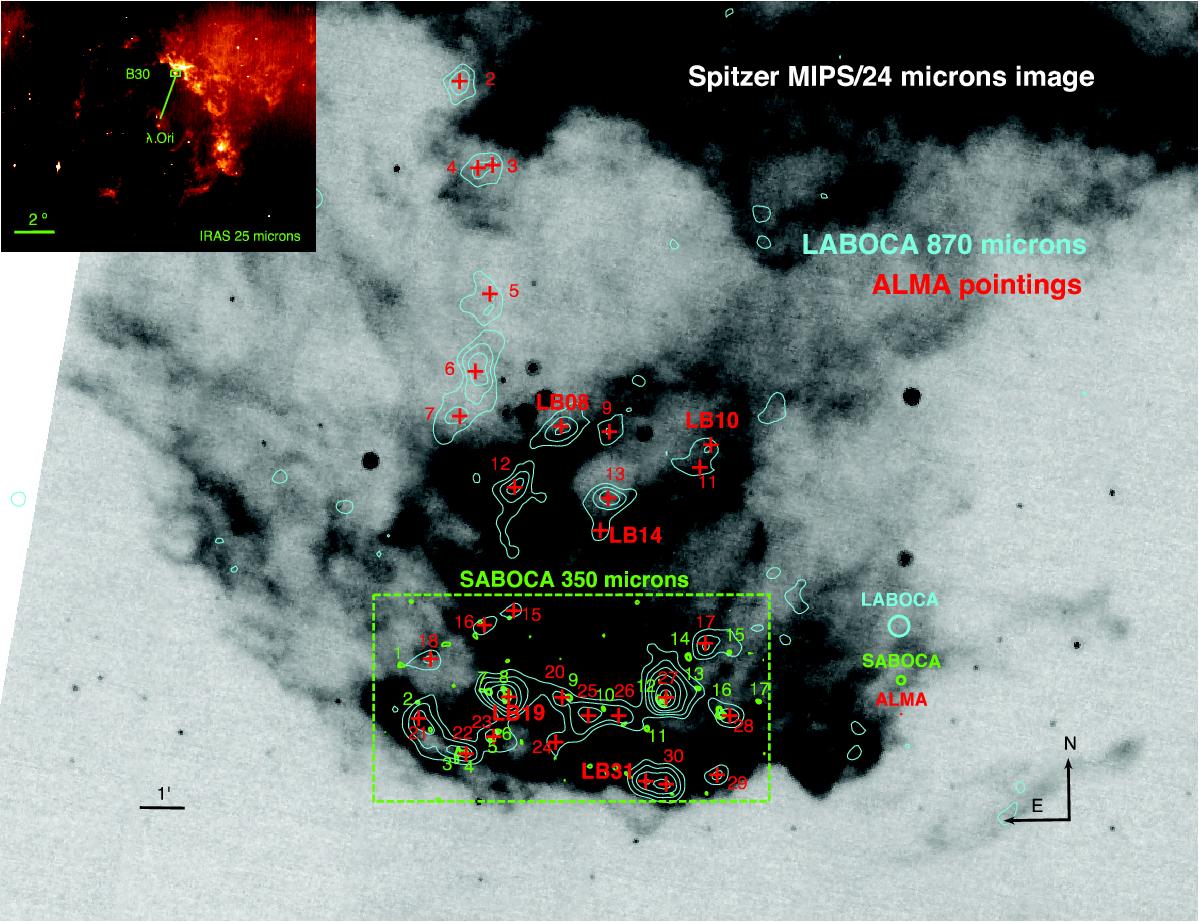
Spitzer 24 μm image of the B30 cloud. The displayed field of view is ~23′ × 18′. The cyan contours represent the APEX/LABOCA map at 870 μm discussed in BGH16 (we show 3, 5, 7, 9, 12 and 15σ levels). The red crosses show the ALMA pointing coordinates, and correspond to the pixels with maximum intensity of the LABOCA cores. The cores are numbered from 2 to 31 following BGH16. The five sources detected with ALMA are marked with red labels. The green contours (2.5, 3, 4 and 5σ levels) represent the APEX/SABOCA data, and the green box the total field of view of the APEX/SABOCA map. We have numbered the 17 APEX/SABOCA sources that are detected above the 3σ level. The beam sizes of each dataset are included on the right part of the image. Finally, the image at the top left corner shows the whole LORI region as seen by IRAS at 25 μm, and the green box represents the B30 area studied with APEX/LABOCA and ALMA.
Current usage metrics show cumulative count of Article Views (full-text article views including HTML views, PDF and ePub downloads, according to the available data) and Abstracts Views on Vision4Press platform.
Data correspond to usage on the plateform after 2015. The current usage metrics is available 48-96 hours after online publication and is updated daily on week days.
Initial download of the metrics may take a while.