Fig. 2
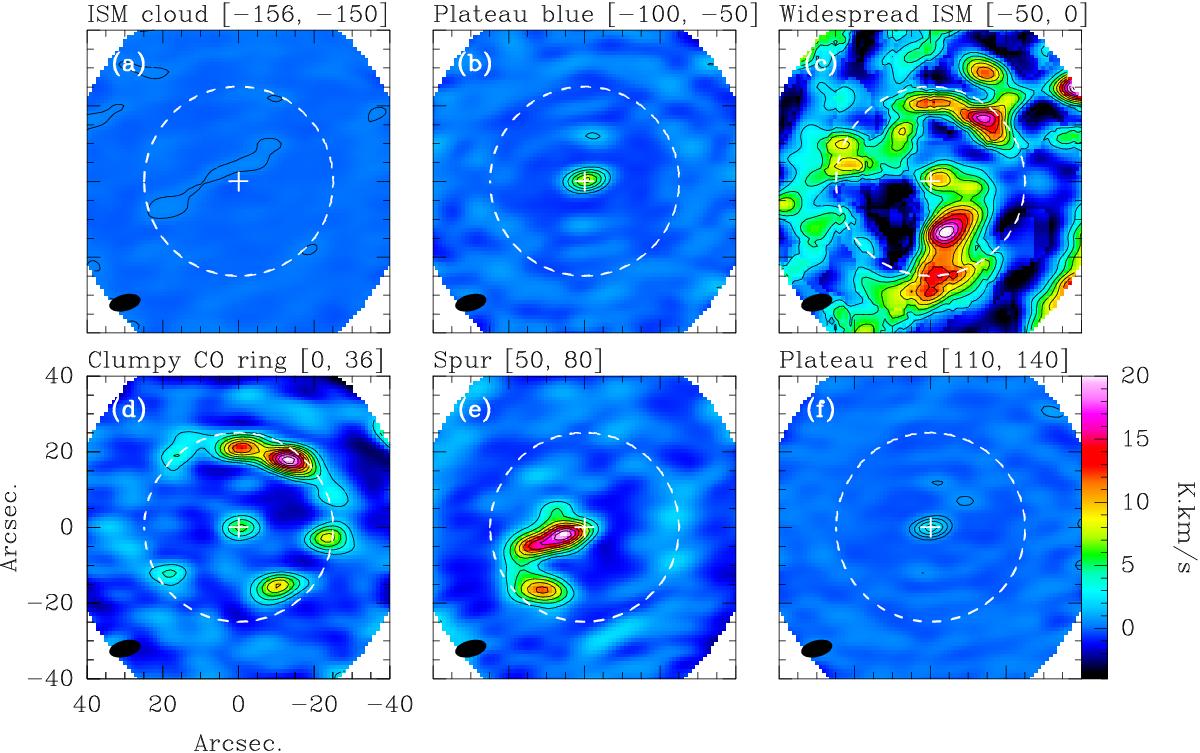
Integrated CO 2–1 maps over several different features in the ACA data, with the velocity range of each map given in brackets. North is up and East is to the left in each map. a) An interstellar cloud around −150km s-1. Contours start at 4σ and are spaced by 4σ (σ = 57 mK km s-1). b) The blue edge of the stellar wind plateau between −100 and −50km s-1. Contours start at 10σ and are spaced by 10σ (σ = 146 mK km s-1). c) Widespread ISM emission between −50 and 0 km s-1. Contours start at 15σ and are spaced by 15σ (σ = 140 mK km s-1). d) The stellar wind at the star, and the clumpy CO ring, integrated between 0 and +36 km s-1, symmetrically around the systemic velocity. Contours start at 15σ and are spaced by 15σ (σ = 124 mK km s-1). e) The spur, integrated between 50 and 80 km s-1. Contours start at 20σ and are spaced by 20σ (σ = 114 mK km s-1). f) The red edge of the stellar wind plateau between +110 and +140 km s-1. Contours start at 5σ and are spaced by 5σ (σ = 114 mK km s-1). The restoring beam (8.4′′ × 4.3′′) is shown as a filled ellipse in the bottom left of each map, and the common color scale is shown in the bottom right map. The location of the star is marked with a cross and the dust shell seen with Herschel is represented by a dashed circle with 25′′ radius.
Current usage metrics show cumulative count of Article Views (full-text article views including HTML views, PDF and ePub downloads, according to the available data) and Abstracts Views on Vision4Press platform.
Data correspond to usage on the plateform after 2015. The current usage metrics is available 48-96 hours after online publication and is updated daily on week days.
Initial download of the metrics may take a while.