Fig. 1
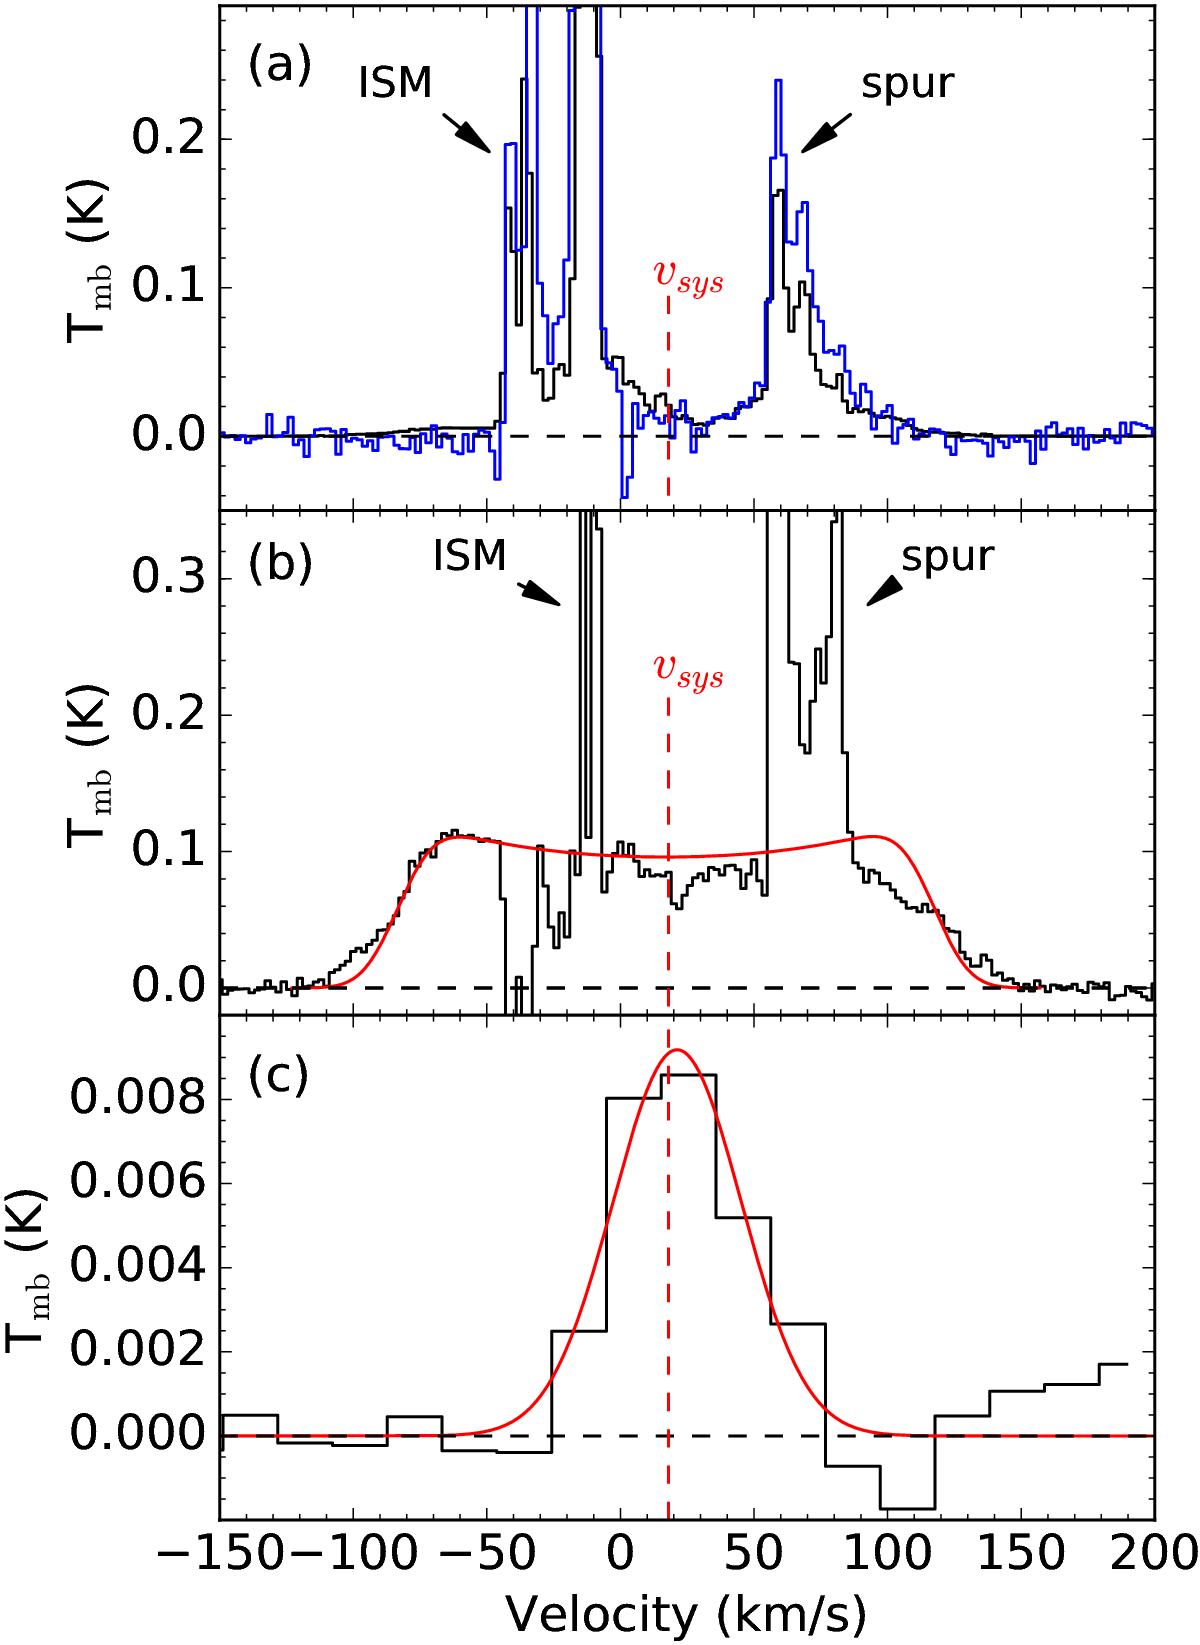
a) In black, a spectrum of the CO 2–1 ACA data smoothed to the 27′′ beam of APEX. In blue, the APEX CO 2–1 spectrum from Wallström et al. (2015). b) ACA CO 2–1 spectrum summed over the synthesised beam at the position of IRAS 17163, showing the broad plateau seen only towards the star. The best fit mass-loss model is overlaid in red. c) The H30α spectrum, averaged over the synthesised beam at the position of IRAS 17163. The best fit Gaussian line profile is overlaid in red, centered on 21 km s-1 with a FWHM of 57 km s-1. In all spectra the systemic velocity at +18 km s-1 (see Sect. 3.3) is marked with a dashed red line, and in spectra a) and b) the absorption-like features between −50 and 0 km s-1 are artefacts caused by the filtering out of extended emission.
Current usage metrics show cumulative count of Article Views (full-text article views including HTML views, PDF and ePub downloads, according to the available data) and Abstracts Views on Vision4Press platform.
Data correspond to usage on the plateform after 2015. The current usage metrics is available 48-96 hours after online publication and is updated daily on week days.
Initial download of the metrics may take a while.