Fig. 3
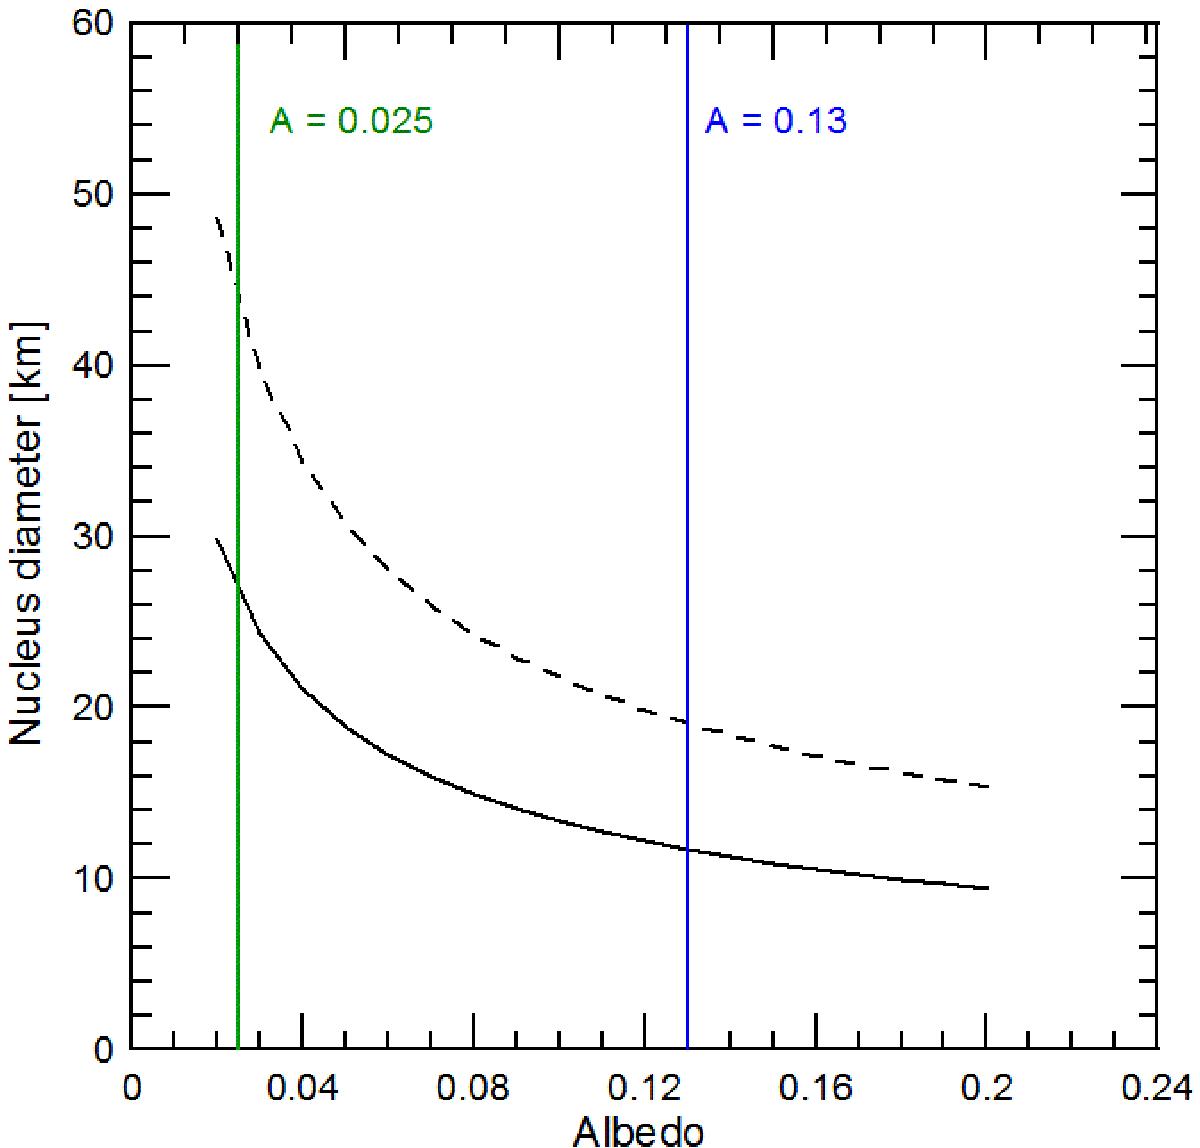
“Diameter curve” for the active Centaur P2. The continuous curve corresponds to nucleus diameter obtained with the nucleus magnitude mnucleus (after the subtraction of coma contamination). The dashed curve is the “upper limit” on the nucleus size, obtained with the total photometry mTOT. The vertical lines indicate the lower limit of albedo values derived in the class (green line, Duffard et al. 2014) and the value measured for the two “canonical” active Centaurs (blue line) Chiron (Bus et al. 1989) and 29P/Schwassmann-Wachmann (Cruikshank & Brown 1983).
Current usage metrics show cumulative count of Article Views (full-text article views including HTML views, PDF and ePub downloads, according to the available data) and Abstracts Views on Vision4Press platform.
Data correspond to usage on the plateform after 2015. The current usage metrics is available 48-96 hours after online publication and is updated daily on week days.
Initial download of the metrics may take a while.