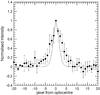
Fig. 2
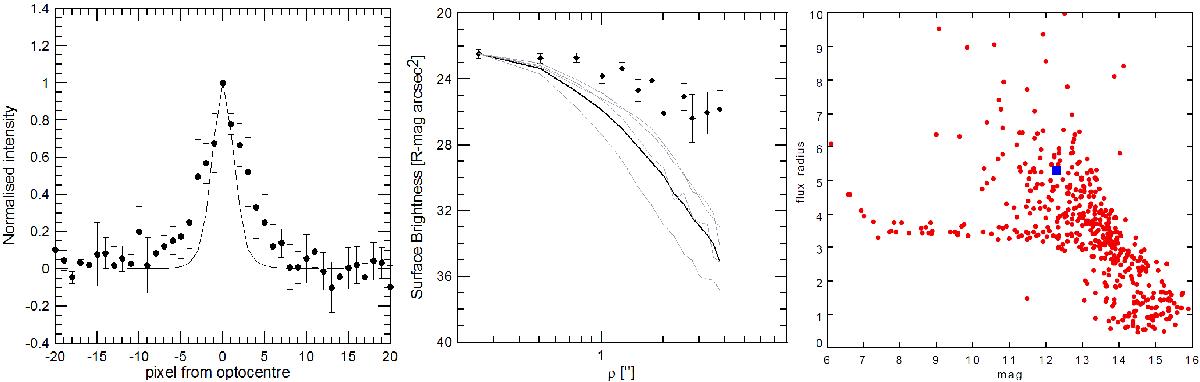
Weak cometary activity of Centaur P2. (Left) Comparison of the averaged P2 profile (black points; error bars on points are due to the dispersion of values among the four extracted profiles) with the average stellar PSF profile (continuous line). (Middle) P2 SBP comparison with the stellar SBP, for four air mass values during the night (the thick line is the average value). (Right) Run of the SExtractor FLUX_RADIUS classifier (see text for details) as a function of the instrumental magnitude. The red dots represent the individual sources, while the blue square marks the position of P2. The straight horizontal sequence is formed by sources classified as sure stars. P2 is clearly above this sequence in the extended sources region.
Current usage metrics show cumulative count of Article Views (full-text article views including HTML views, PDF and ePub downloads, according to the available data) and Abstracts Views on Vision4Press platform.
Data correspond to usage on the plateform after 2015. The current usage metrics is available 48-96 hours after online publication and is updated daily on week days.
Initial download of the metrics may take a while.