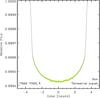
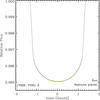
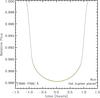
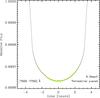
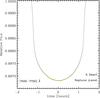
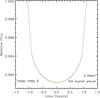
Fig. 9

Transit light curves (with the green shade denoting highest and lowest values) of 42 different synthetic Sun (top row) and K-dwarf star (bottom row) images to account for granulation changes during the transit time length for every planet (Table 3) and considering that the granulation timescale for the Sun is ~10 min. The wavelength band shown is [7620–7640] Å (Table 2).
Current usage metrics show cumulative count of Article Views (full-text article views including HTML views, PDF and ePub downloads, according to the available data) and Abstracts Views on Vision4Press platform.
Data correspond to usage on the plateform after 2015. The current usage metrics is available 48-96 hours after online publication and is updated daily on week days.
Initial download of the metrics may take a while.