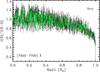
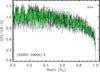
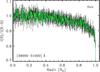
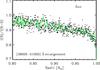
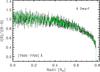
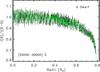
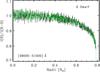
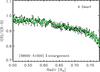
Fig. 4

Intensity profiles obtained from the cut at x = 0, y> 0 in the synthetic disk images of Fig. 2. The black curves are the overlap of N = 42 different images. The number N depends on the duration of the transit of Kepler 11-f (7 h, Table 3) and the observed granulation timescale for the Sun is ~10 min (see text). The intensity profiles are normalized to the intensity at the disk center (R = 0.0). The green line is the temporal average profile.
Current usage metrics show cumulative count of Article Views (full-text article views including HTML views, PDF and ePub downloads, according to the available data) and Abstracts Views on Vision4Press platform.
Data correspond to usage on the plateform after 2015. The current usage metrics is available 48-96 hours after online publication and is updated daily on week days.
Initial download of the metrics may take a while.