Free Access
Fig. 1
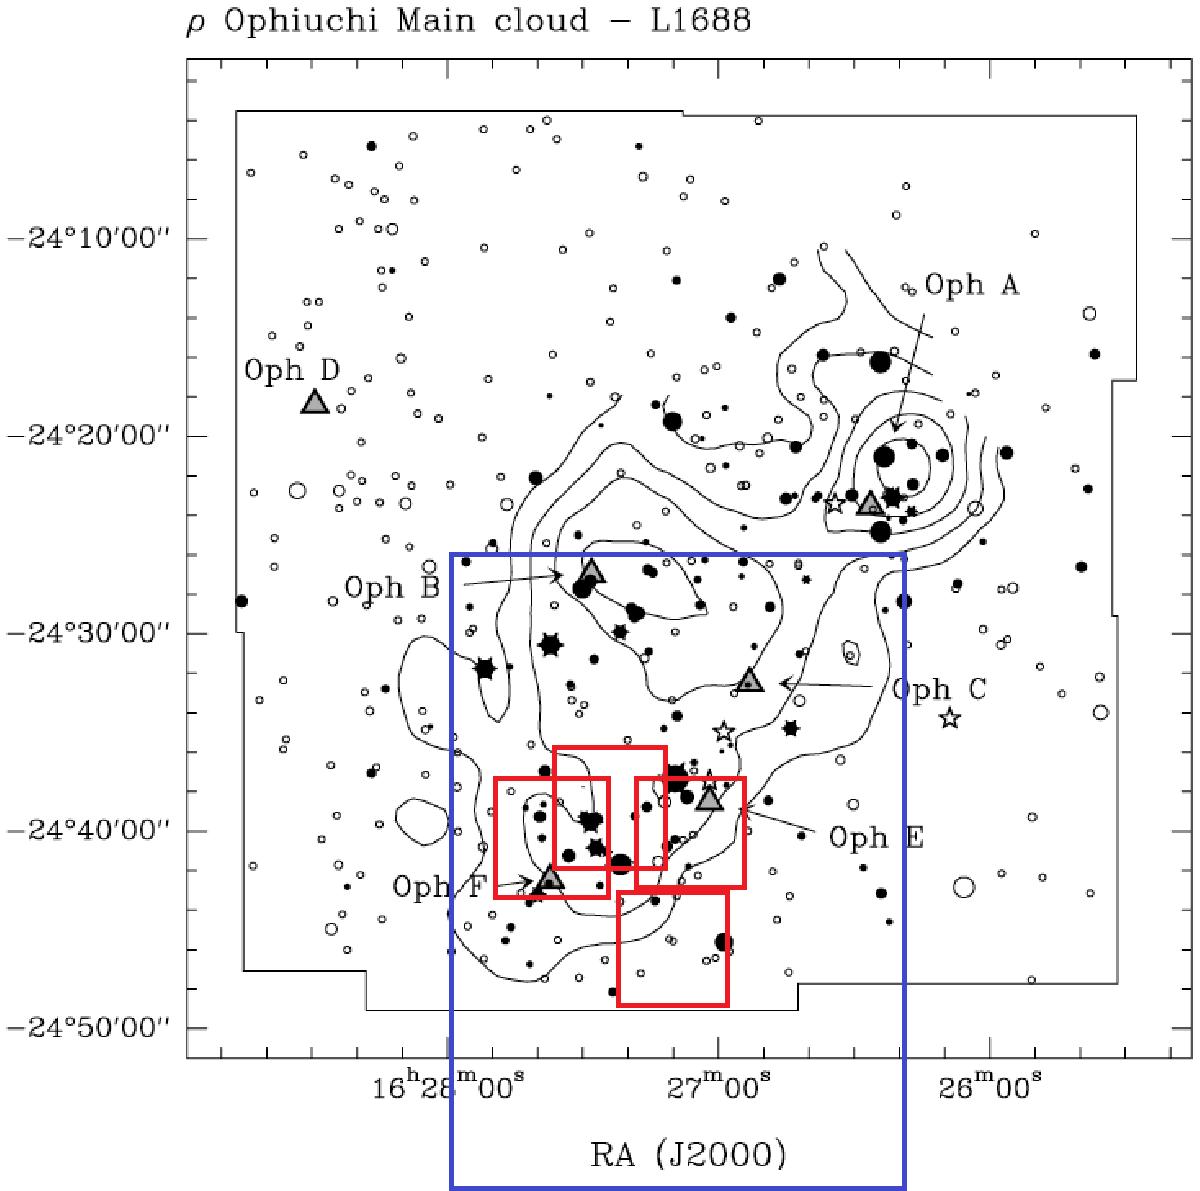
Areas covered by the present proper motion catalogue overlaid on the map of the L1688 dark cloud from Bontemps et al. (2001). Red lines delimitate the NTT-SOFI observations and blue lines give the total extension of the catalogue including auxiliary data.
Current usage metrics show cumulative count of Article Views (full-text article views including HTML views, PDF and ePub downloads, according to the available data) and Abstracts Views on Vision4Press platform.
Data correspond to usage on the plateform after 2015. The current usage metrics is available 48-96 hours after online publication and is updated daily on week days.
Initial download of the metrics may take a while.