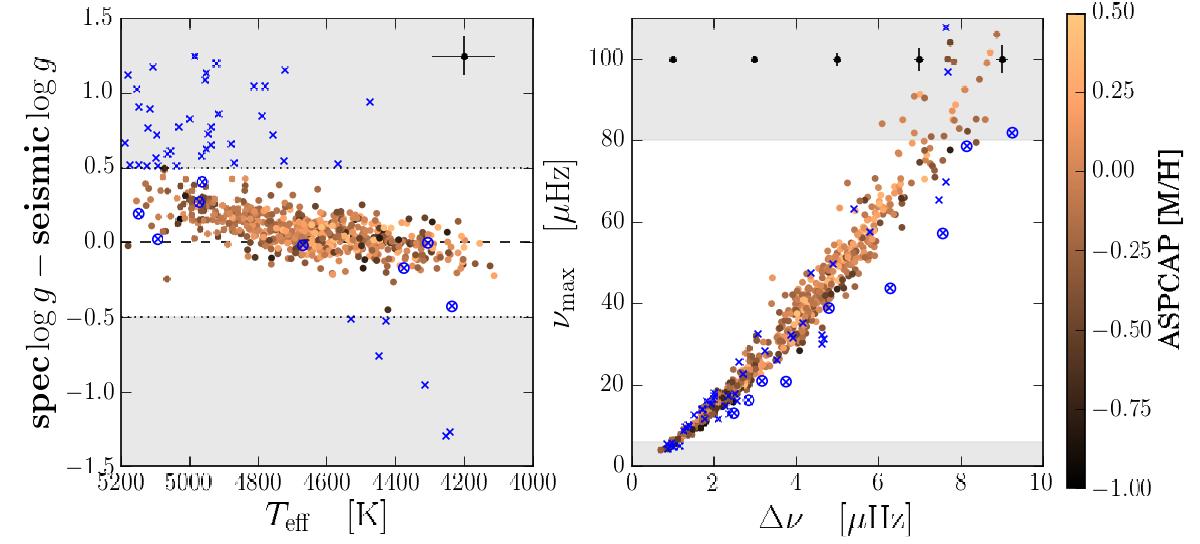
Fig. 4

Left: difference between ASPCAP (calibrated) log g and gravity determined from seismic scaling relations, as a function of effective temperature. Stars located in the grey-shaded area (| log gASPCAP − log gseismo | > 0.5 dex; blue crosses) were excluded from the analysis. Right: νmax − Δν diagram for our program stars. In addition to the log g consistency requirement, nine stars (mostly located far from the νmax − Δν sequence; blue crossed circles) were also rejected by the PARAM pipeline. Error bars in the upper part of the diagrams represent average uncertainties.
Current usage metrics show cumulative count of Article Views (full-text article views including HTML views, PDF and ePub downloads, according to the available data) and Abstracts Views on Vision4Press platform.
Data correspond to usage on the plateform after 2015. The current usage metrics is available 48-96 hours after online publication and is updated daily on week days.
Initial download of the metrics may take a while.


