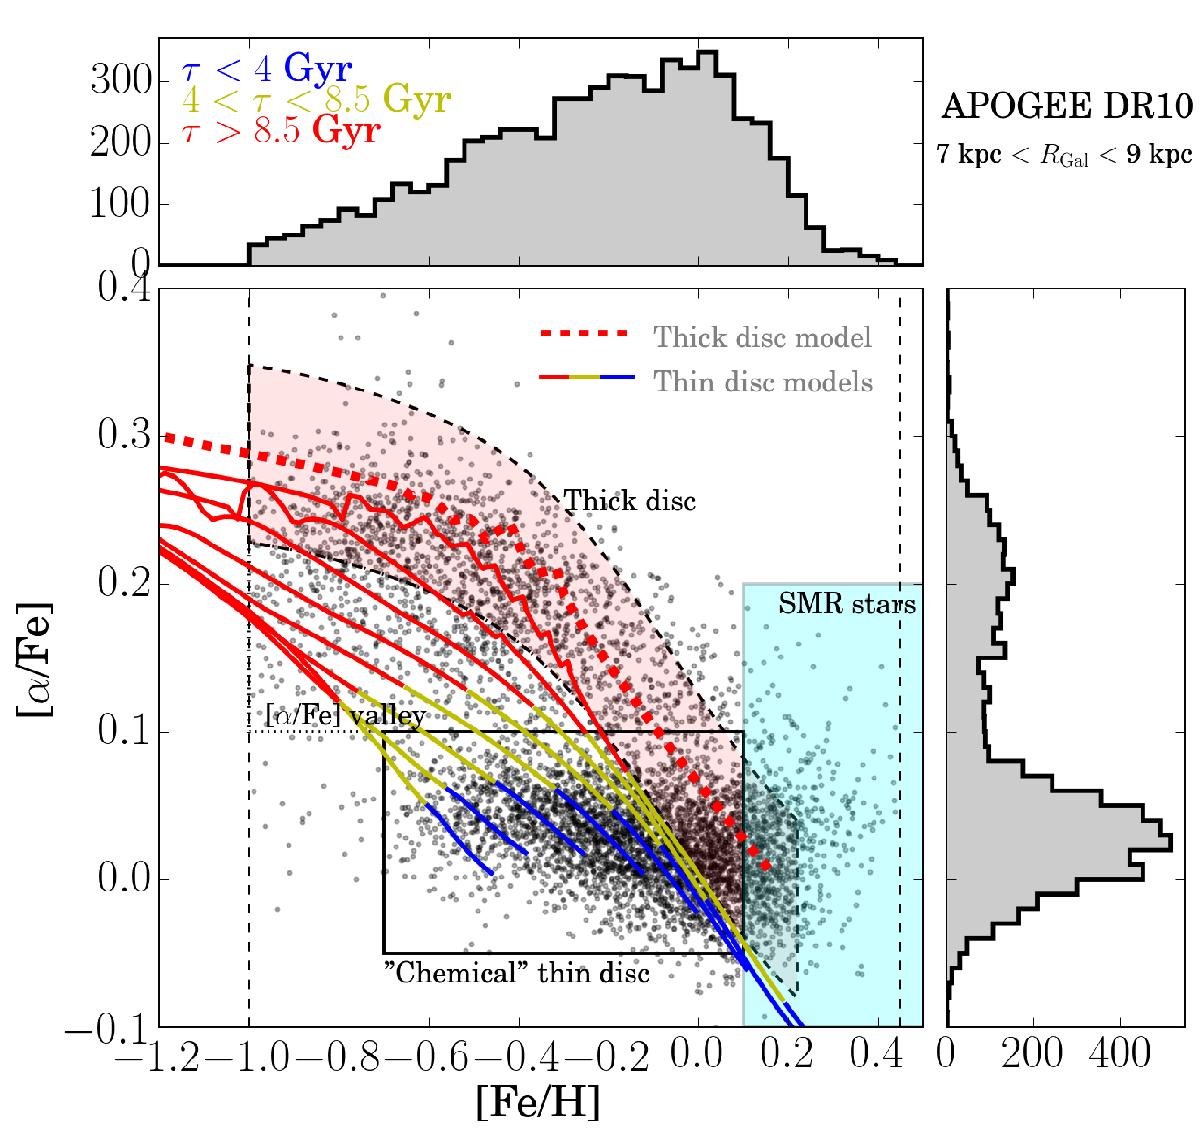
Fig. 13

The [α/Fe] vs. [Fe/H] diagram of the APOGEE DR10 high-quality giant sample (Anders et al. 2014; grey dots) in the range 7 kpc <RGal< 9 kpc. Overplotted with colours are the thin- and thick-disc chemical-evolution models of Chiappini (2009): the solid lines correspond to the chemical tracks of the thin disc at different Galactocentric annuli (from left to right: 18 kpc, 16 kpc, 14 kpc, 12 kpc, 10 kpc, 8 kpc, 6 kpc, 4 kpc). The colours indicate the age (or look-back time), as indicated in the top panel. The dashed line represents a thick-disc model (for RGal = 6 kpc − the Galactocentric dependency for the thick-disc models computed in Chiappini (2009) are minor − see text for more details).
Current usage metrics show cumulative count of Article Views (full-text article views including HTML views, PDF and ePub downloads, according to the available data) and Abstracts Views on Vision4Press platform.
Data correspond to usage on the plateform after 2015. The current usage metrics is available 48-96 hours after online publication and is updated daily on week days.
Initial download of the metrics may take a while.


