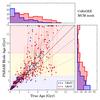
Fig. 11

Estimating systematics of our age estimates using simulated stars. The scatter plot in the upper panel shows estimated PARAM ages of the CoRoGEE mock stars (and their statistical 1σ uncertainties as error bars) vs. the true ages of the parent N-body particle. The histograms to the sides of this plot show the corresponding age distributions of the two CoRoT fields. The background colours correspond to the three age bins used in Sect. 4. The lower plot shows the relative age error ![]() as a function of the true age. The black symbols correspond to the median age error in each age bin indicated on the x axis. The various lines correspond to a one-to-one relation, 20% and 50% deviation, and the age boundary at 13.8 Gyr.
as a function of the true age. The black symbols correspond to the median age error in each age bin indicated on the x axis. The various lines correspond to a one-to-one relation, 20% and 50% deviation, and the age boundary at 13.8 Gyr.
Current usage metrics show cumulative count of Article Views (full-text article views including HTML views, PDF and ePub downloads, according to the available data) and Abstracts Views on Vision4Press platform.
Data correspond to usage on the plateform after 2015. The current usage metrics is available 48-96 hours after online publication and is updated daily on week days.
Initial download of the metrics may take a while.


