Fig. 9
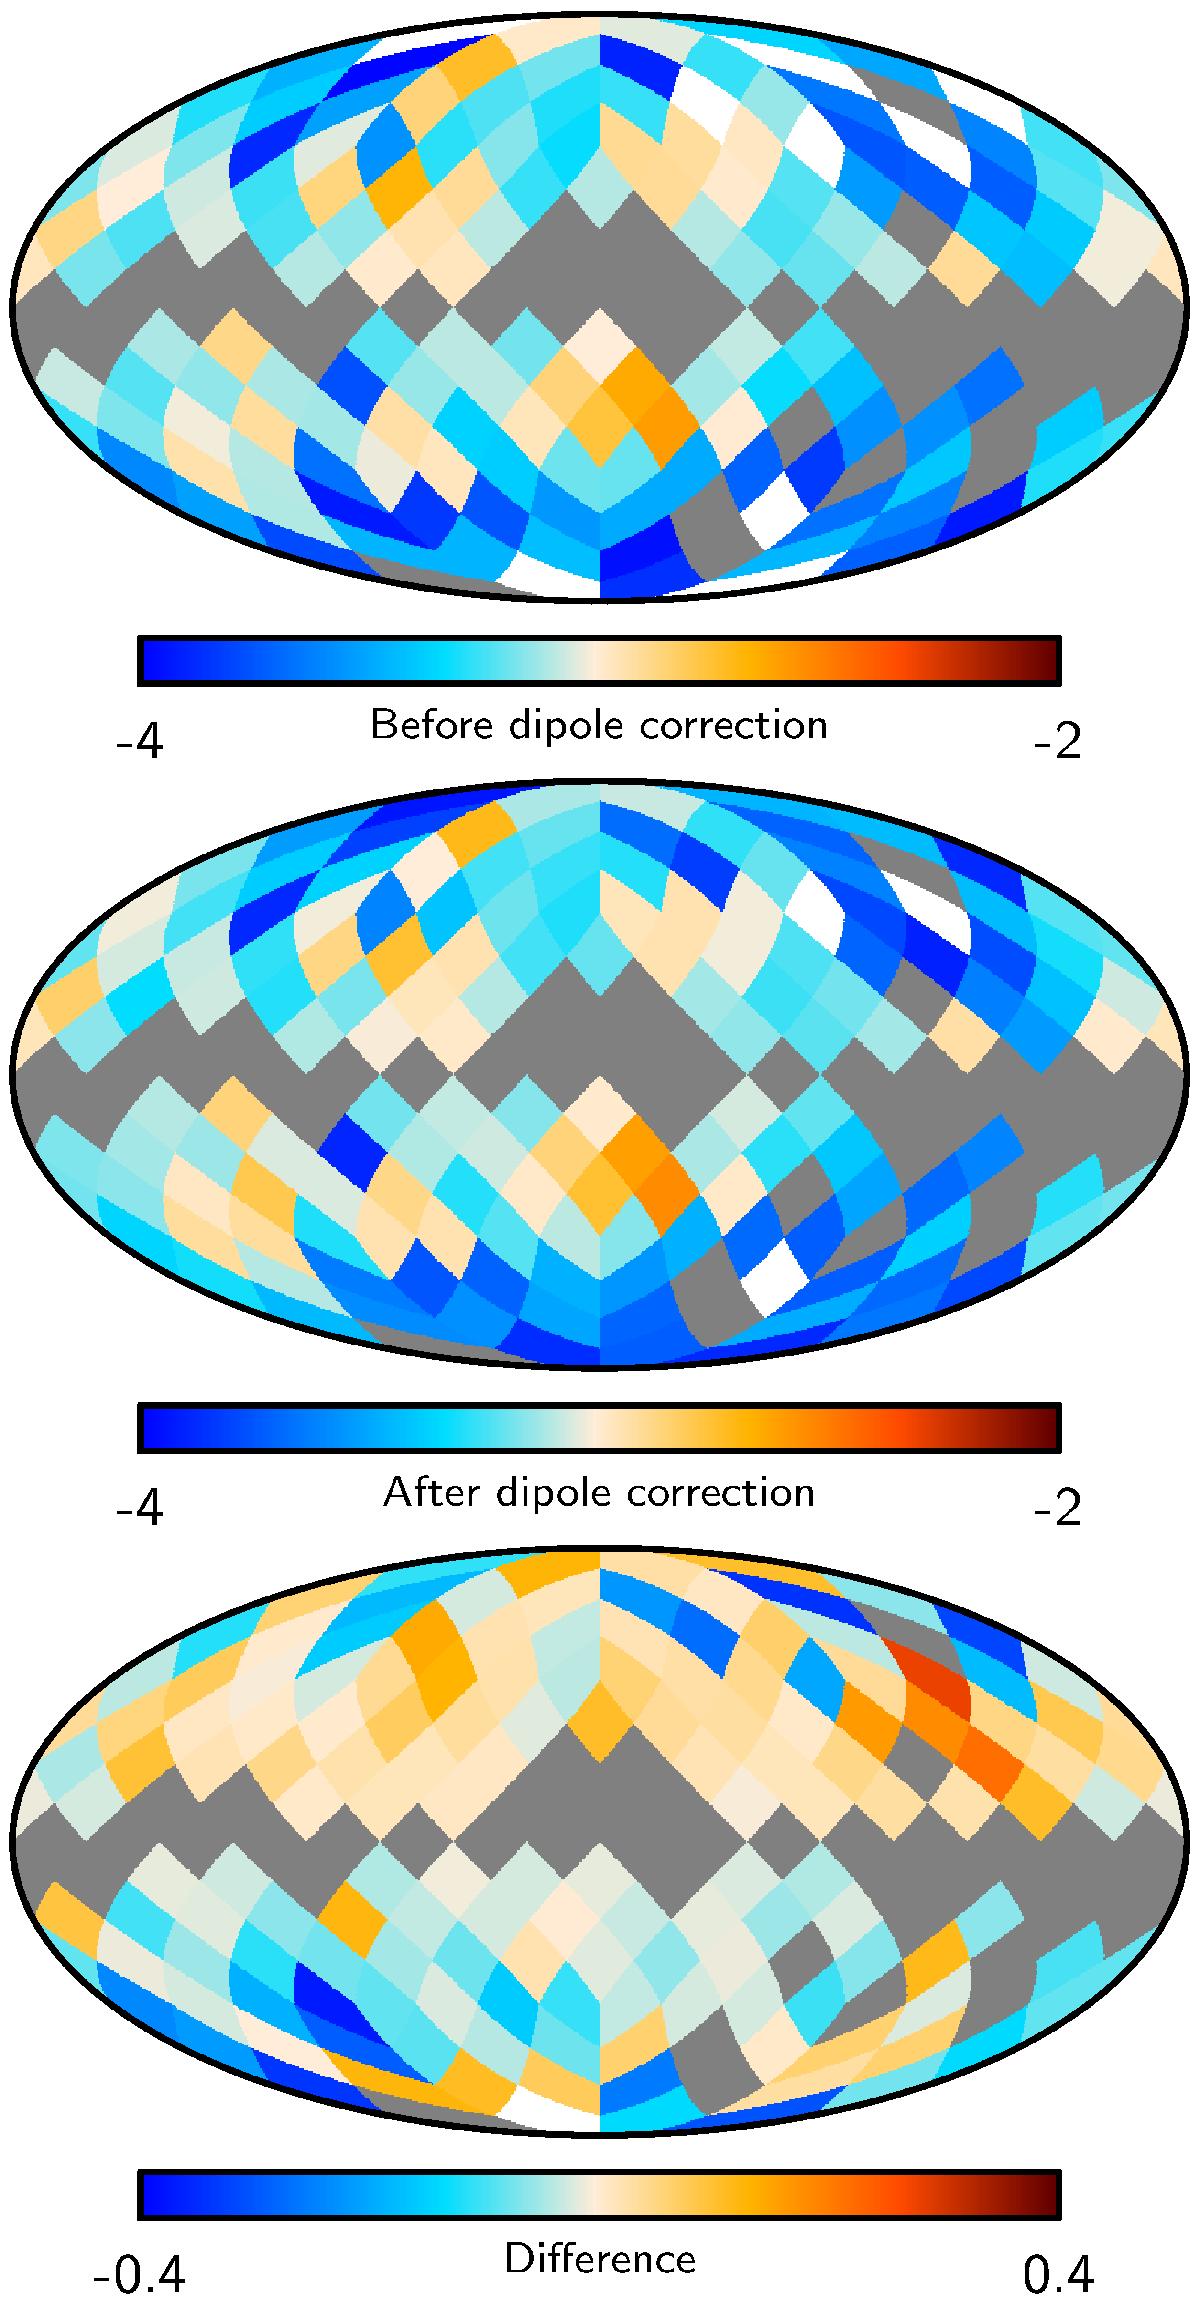
Estimates of the spectral index derived from the combination of the 408 and 1420 MHz maps using T−T plots, both before (top) and after (middle) applying the offset corrections. The bottom panel shows the difference. These differences show directly the magnitude of the bias in T−T plot based spectral indices due to spurious dipoles.

Current usage metrics show cumulative count of Article Views (full-text article views including HTML views, PDF and ePub downloads, according to the available data) and Abstracts Views on Vision4Press platform.
Data correspond to usage on the plateform after 2015. The current usage metrics is available 48-96 hours after online publication and is updated daily on week days.
Initial download of the metrics may take a while.