Fig. 6
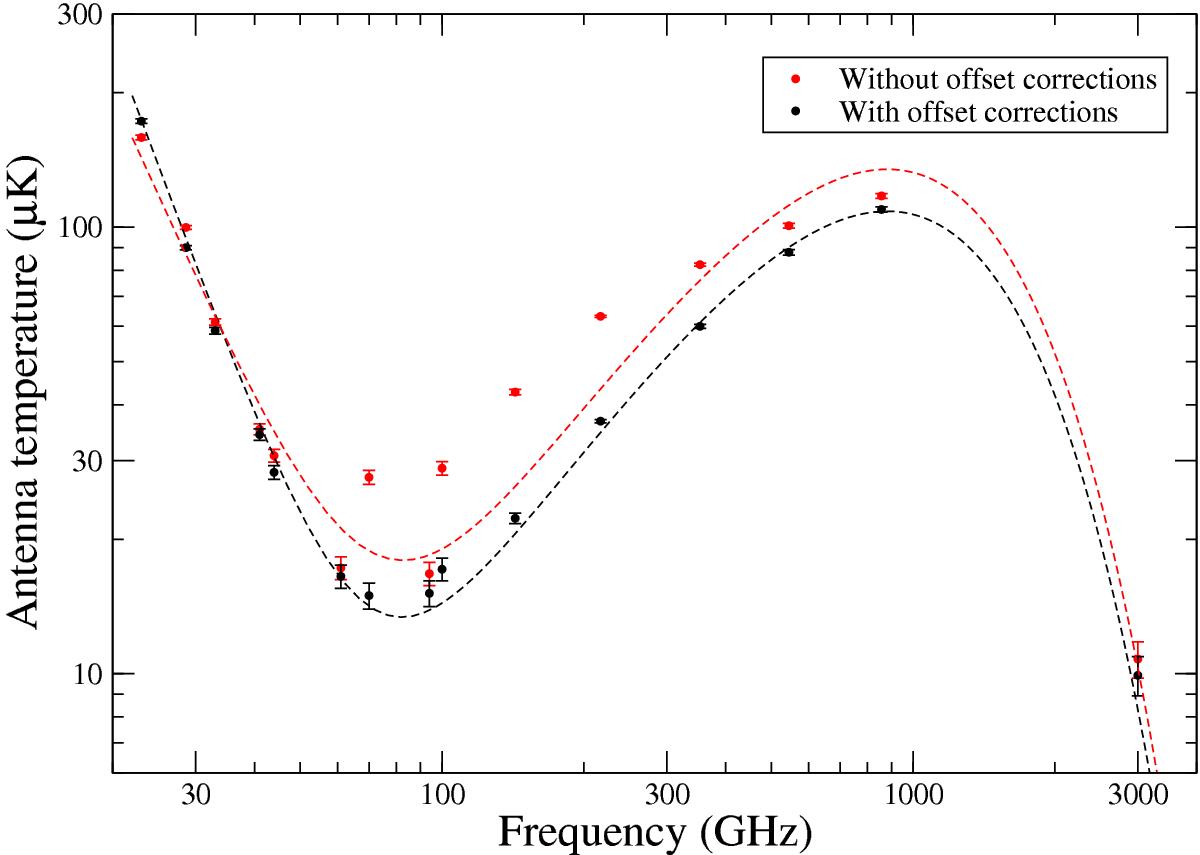
Mean antenna temperature as a function of frequency, measured outside the union mask before (red points) and after (black points) offset corrections. The dashed lines shows the best-fit sum of a low-frequency power-law (with free spectral index) and a one-component greybody (with fixed emissivity of βd = 1.6 and temperature TK = 18 K; Planck Collaboration XI 2013; Planck Collaboration XII 2013; Planck Collaboration Int. XVII 2014; Planck Collaboration Int. XXII 2014) to each of the two cases.
Current usage metrics show cumulative count of Article Views (full-text article views including HTML views, PDF and ePub downloads, according to the available data) and Abstracts Views on Vision4Press platform.
Data correspond to usage on the plateform after 2015. The current usage metrics is available 48-96 hours after online publication and is updated daily on week days.
Initial download of the metrics may take a while.