Fig. 2
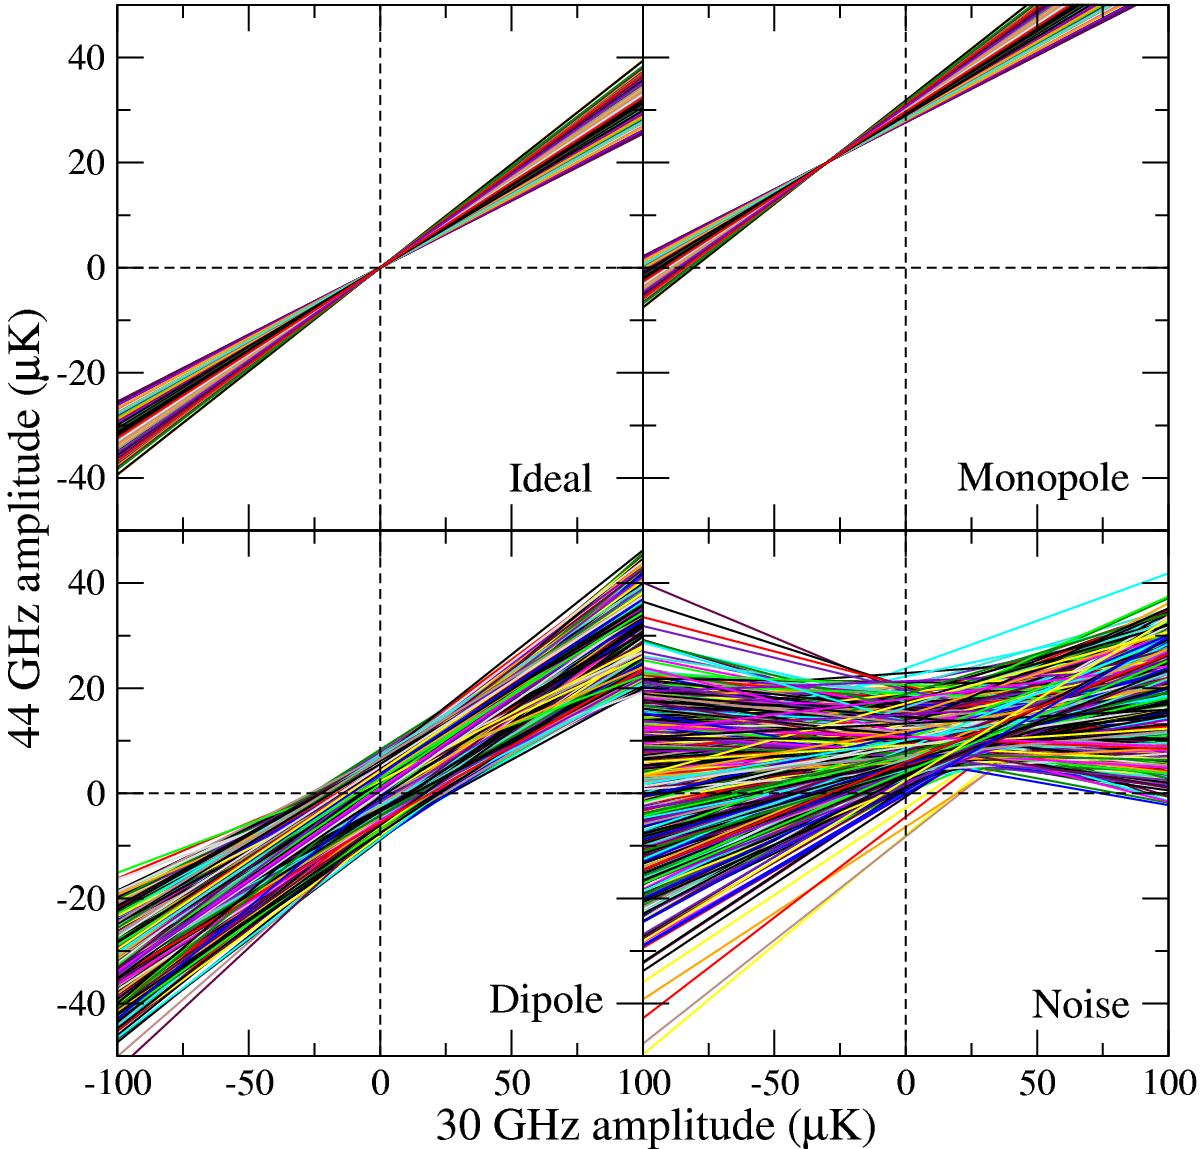
T−T summary plot of four different simulations. Each coloured line corresponds to the best-fit to a single HEALPix Nside = 8 region, evaluated from underlying an Nside = 256 synchrotron-only simulation. The top left panel shows the ideal case with neither spurious offsets nor instrumental noise; all lines converge perfectly on the origin. In the top right panel spurious offsets of −30 and +20μK are added to the two frequencies, resulting in a simple corresponding translation of the entire plot. The bottom left panel shows the effect of a spurious dipole; the lines no longer converge on a single point, as each region is effectively translated by a different offset. Finally, the bottom right panel illustrates the effect of instrumental noise.
Current usage metrics show cumulative count of Article Views (full-text article views including HTML views, PDF and ePub downloads, according to the available data) and Abstracts Views on Vision4Press platform.
Data correspond to usage on the plateform after 2015. The current usage metrics is available 48-96 hours after online publication and is updated daily on week days.
Initial download of the metrics may take a while.