Fig. 1
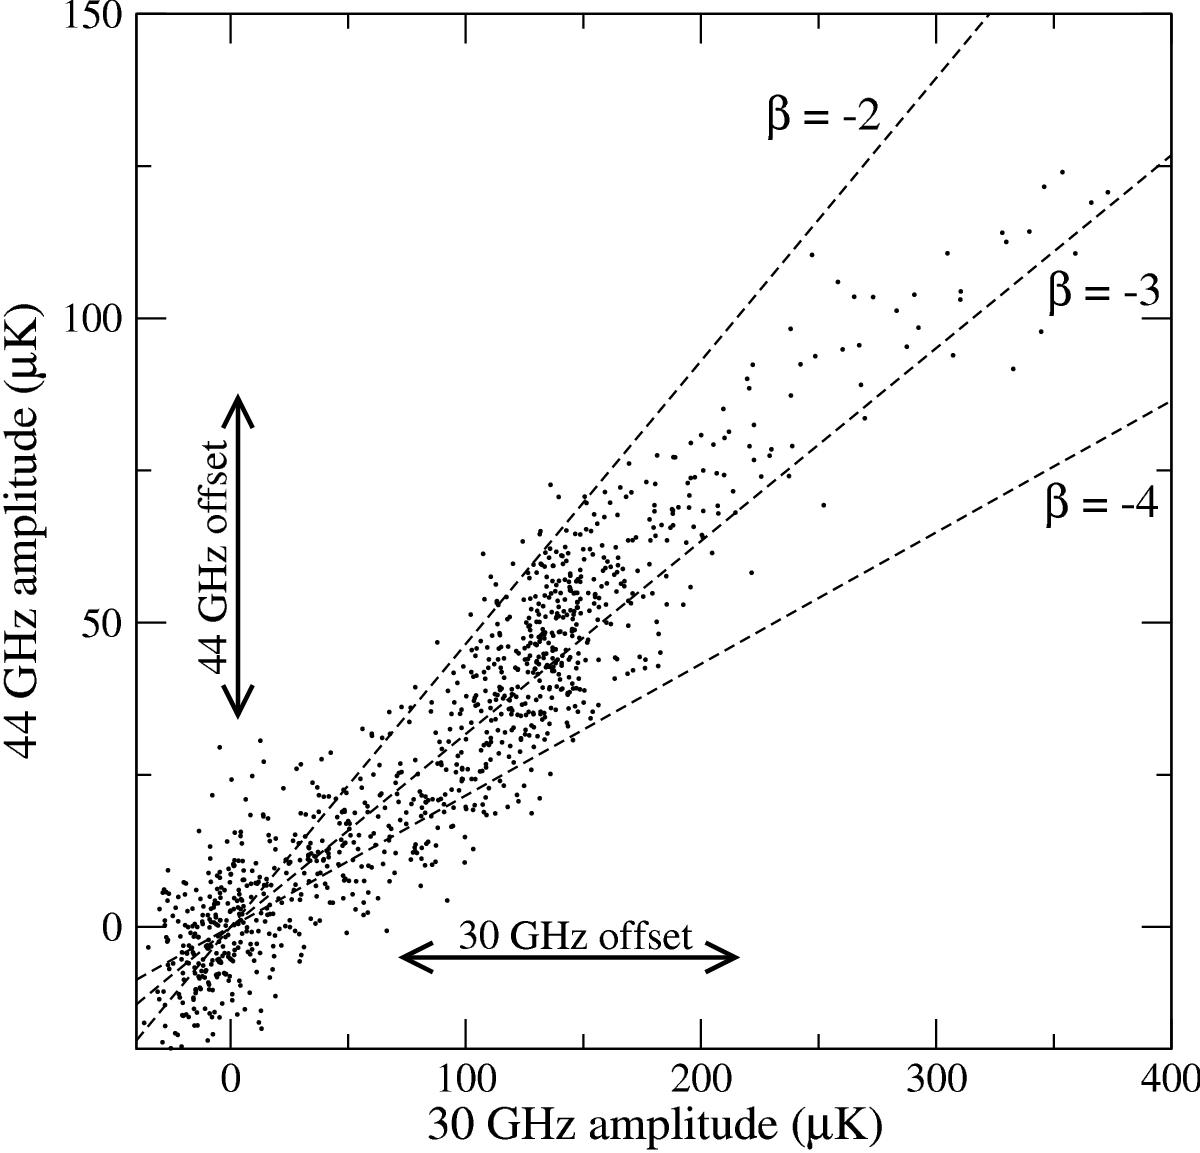
Schematic illustration of a single T−T plot evaluated for an ideal low-frequency Planck simulation (30 and 44 GHz). Each dot represents the observed values at two frequencies for a single pixel. The slope of the distribution is given by the spectral index of the signal component in the field, as indicated by the dashed lines. A constant offset in either frequency map simply translates the entire T−T plot either horizontally or vertically. For maps without spurious offsets, the best-fit straight line should pass through the origin; the fundamental idea of the algorithm presented in this paper is to ensure that this is the case for any sufficiently small patch of the sky.
Current usage metrics show cumulative count of Article Views (full-text article views including HTML views, PDF and ePub downloads, according to the available data) and Abstracts Views on Vision4Press platform.
Data correspond to usage on the plateform after 2015. The current usage metrics is available 48-96 hours after online publication and is updated daily on week days.
Initial download of the metrics may take a while.