Free Access
Fig. 4
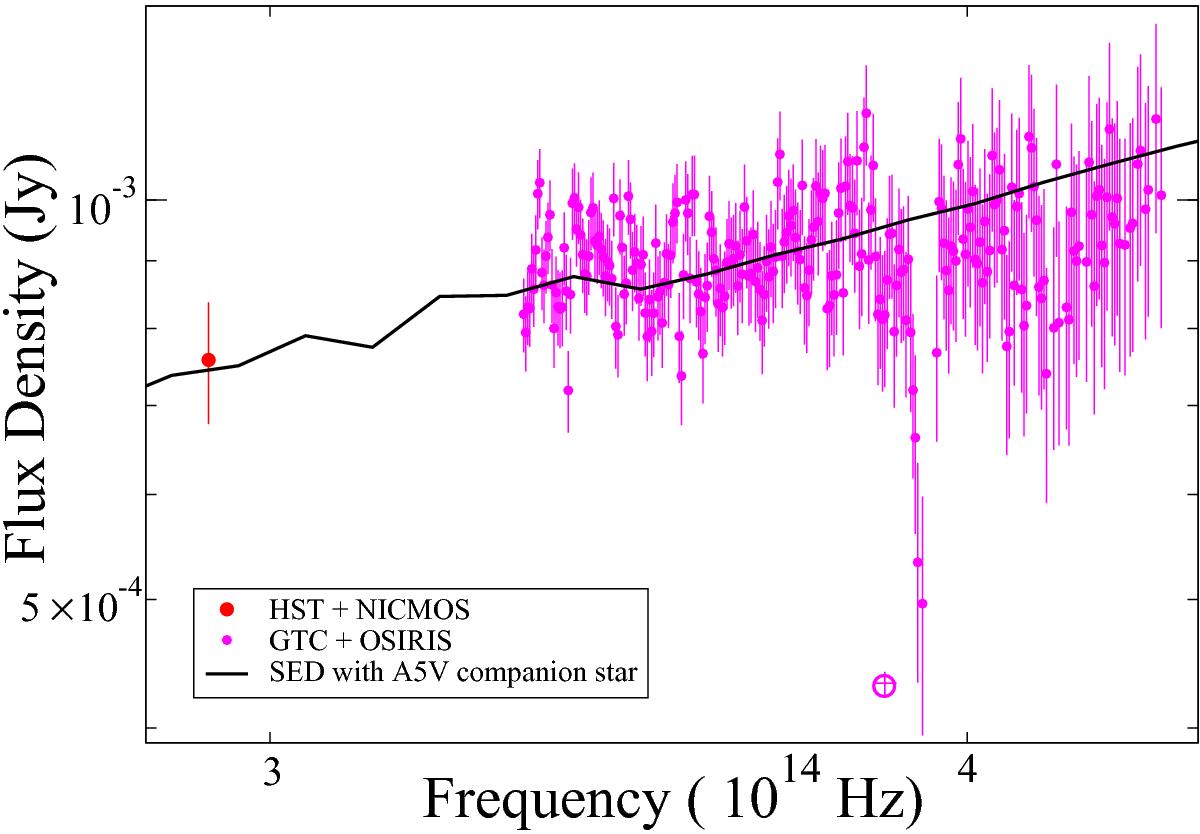
Detailed view of the de-reddened GTC spectrum as a function of frequency and including estimated error bars. The solid line is the SED fit corresponding to the ![]() minimum in Fig. 3 obtained for an A5V star. The symbol ⊕ marks the strongest telluric absorption that is excluded from the fit.
minimum in Fig. 3 obtained for an A5V star. The symbol ⊕ marks the strongest telluric absorption that is excluded from the fit.
Current usage metrics show cumulative count of Article Views (full-text article views including HTML views, PDF and ePub downloads, according to the available data) and Abstracts Views on Vision4Press platform.
Data correspond to usage on the plateform after 2015. The current usage metrics is available 48-96 hours after online publication and is updated daily on week days.
Initial download of the metrics may take a while.