Fig. 2
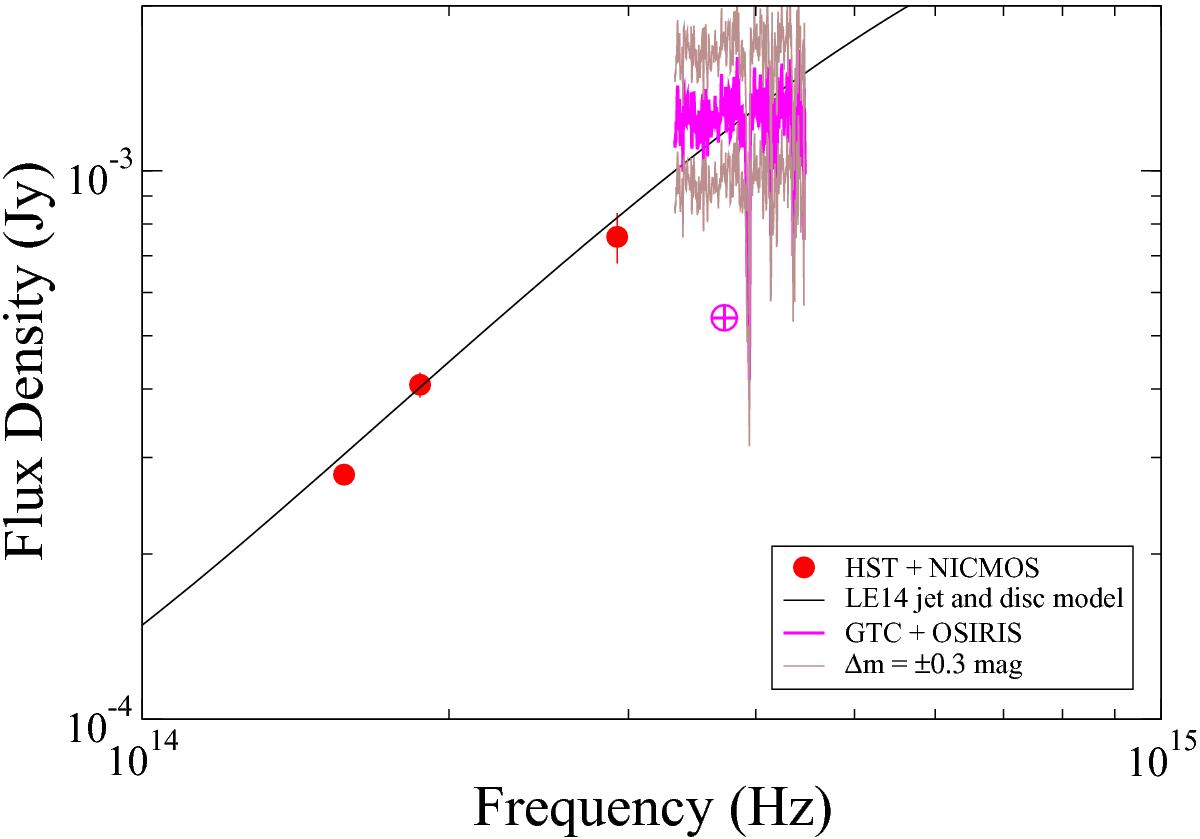
De-reddened GTC spectrum of GRS 1758−258 plotted together with HST-NICMOS observations and the irradiated disc model by Luque-Escamilla et al. (2014) labelled as LE14. For comparison purposes, the GTC spectrum has also been plotted in brown scaled by a factor corresponding to variability and absolute flux uncertainty effects with Δm = ± 0.3 mag. The symbol ⊕ denotes the strongest telluric absorption feature.
Current usage metrics show cumulative count of Article Views (full-text article views including HTML views, PDF and ePub downloads, according to the available data) and Abstracts Views on Vision4Press platform.
Data correspond to usage on the plateform after 2015. The current usage metrics is available 48-96 hours after online publication and is updated daily on week days.
Initial download of the metrics may take a while.