Fig. 7
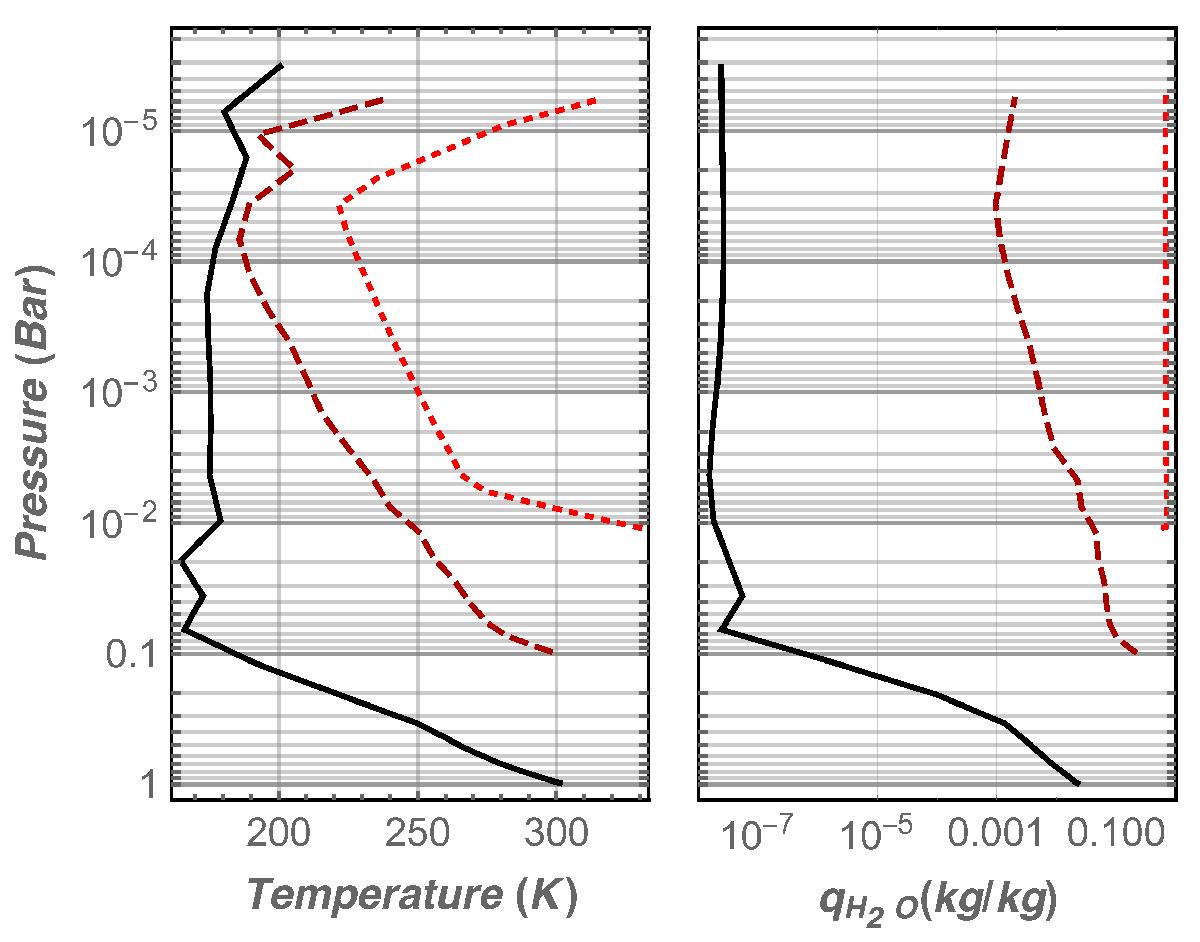
Annual mean atmospheric temperature (left) and water vapor (right) vertical profiles of atmospheres with different total surface pressure (solid black: 1 bar; dashed, dark red: 0.1 bar; dotted red: 0.01 bar). The composition of all three atmospheres is N2 with 376 ppm of CO2 and a variable amount of water vapor. The profiles are shown at the substellar point, but horizontal variations are fairly small above the 0.1 mbar level due to an efficient transport. Decreasing the surface pressure increases the water vapor ratio in the upper atmosphere drastically.
Current usage metrics show cumulative count of Article Views (full-text article views including HTML views, PDF and ePub downloads, according to the available data) and Abstracts Views on Vision4Press platform.
Data correspond to usage on the plateform after 2015. The current usage metrics is available 48-96 hours after online publication and is updated daily on week days.
Initial download of the metrics may take a while.